A mini project on sales analysis in python using Matplotlib, Pandas and Seaborn
Upon initial ispection of the data, we can start thinking of some questions about it that we would want to answer.
- What is overall sales trend?
- What are top 10 products by sale?
- What are most selling products?
- Which is the most preferred shipping mode?
- Which are profitable categories and sub categories?
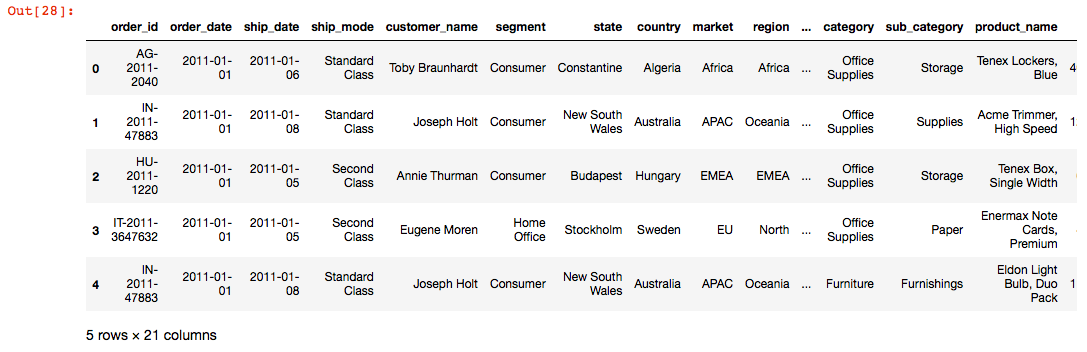
We cannot work with the data until we know what are we dealing with, for example,
- Sales, Product name column
- Looking for any missing data
- Number of rows and so on.
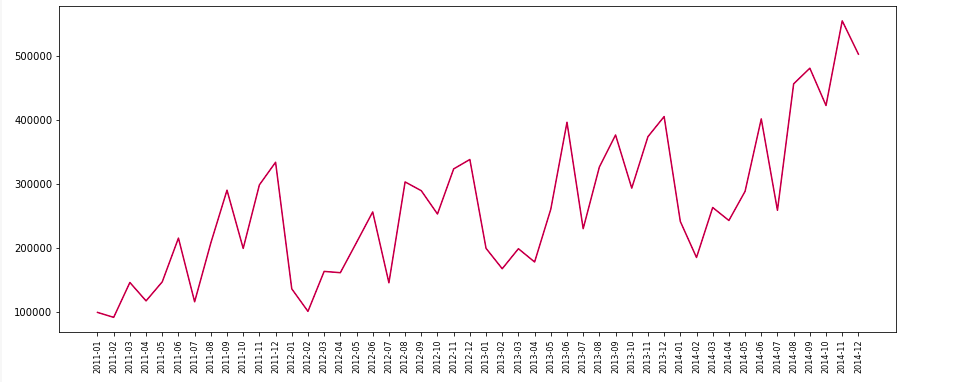
WHAT IS OVERALL SALES TREND?
- Approach
- Generate a new column with Year and Date in format (YYYY-MM)
- Group all the Sales of the same Month and combine it with the above New Column
- Plot the new dataframe with X axis as Month-Year and Y axis as COmbined Month Sales
Result :
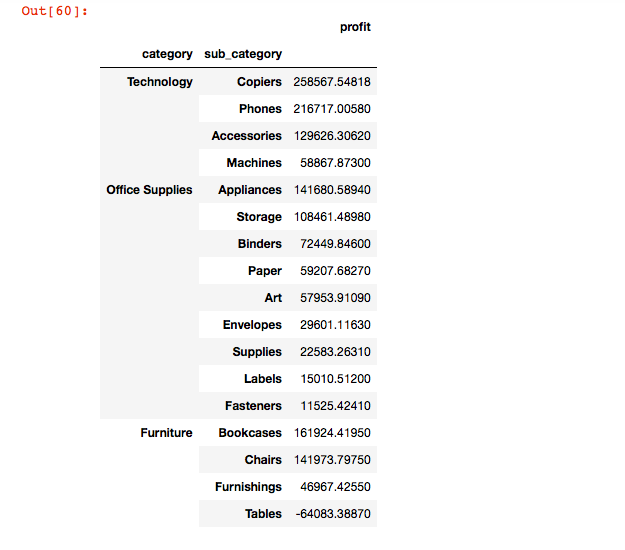
WHICH ARE PROFITABLE CATEGORIES AND SUB-CATEGORIES?
- Approach
- Filter out a new data set with categories, its sub Categories and the respective Profits
- Sort the data in descending order.
Result :
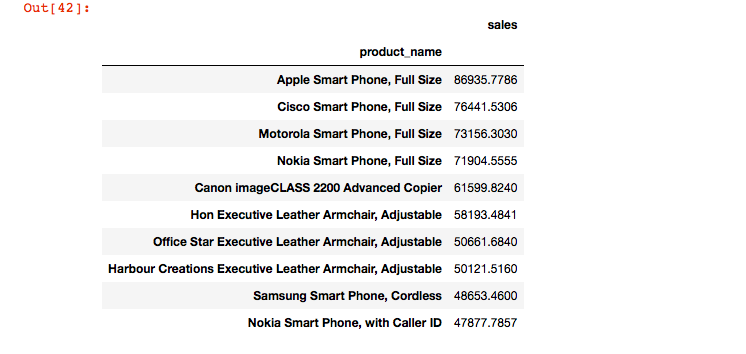
WHICH ARE TOP 10 PRODUCTS BY SALE?
- Approach
- We need two columns, product name and the sales.
- We will get the combined sale for that project using groupby
- Arrange it in decending order and print out top 10 objects.
Result :
WHICH ARE MOST SELLING PRODUCTS?
- Approach
- We need a table which contain Product name and the combined quantity sold.
- Group that into a dataframe.
- Arrange them in descending order and print only first 5.
Result :

WHICH IS MOST PREFERRED SHIPPING MODE?
- Approach
- Counting and grouping each Ship mode using Seaborn
Result :
