Home
In this example I'd like to show something that can help handling a common problem: making sense of
a dataset with multiple time series of the same type.
I'll show how to solve such a problem using a data structure provided by Pandas, the Panel.
Before talking about the Panel I'd like to take a few steps back and briefly describe other common data structures that are available in Pandas and that are leveraged by the Panels.
First things first, because we deal with time series we have the Series.
A Series is an object that contains an array of values with an index associated to them.
For a time series the index can contain date and time values but it could be anything.
Second we have the DataFrame. If you think the Series as a single column, the DataFrame is a table.
The DataFrame is an object that groups multiple Series that share the same index.
The DataFrame is one of the most common data structures in Pandas.
DataFrames let you work as if you had a very fast in memory data base, perfect for analyzing data sets
up to few GB.
Now we're ready for the Panel. The Panel is the natural extension of the DataFrame and can be seen as a 3D table, or a collection of multiple DataFrames.

I'd like to show how to use a Panel in order to quickly visualize data and explore
a data set. Given my recent involvement with energy metering solutions
I'll take an example from the electrical domain.
Imagine we're monitoring five different houses, and for every house we have a data set that contains voltage current and power with a time resolution of two minutes. We're given five different CSV files containing the data. Every file looks like this
date,Vrms,Irms,Power
Sat Jan 09 2016 00:00:00 GMT-0800 (PST),122.89474233,0.751786349902,92.2478478392
Sat Jan 09 2016 00:02:00 GMT-0800 (PST),122.89474233,0.751786349902,92.2478478392
Sat Jan 09 2016 00:04:00 GMT-0800 (PST),122.89474233,0.751786349902,92.2478478392
Sat Jan 09 2016 00:06:00 GMT-0800 (PST),122.89474233,0.751786349902,92.2478478392
...
and named like house<#house>.csv.
This is a quite common situation. We have N data sets containing
time series data with a homogeneous data structure.
If you think about it we have have to deal with three dimensions, and the Panel seems just the
right data structure for this kind of job.
The dimensions we'll consider are
- the different houses (items in Panel-lingo)
- time index (major-axis in Panel-lingo)
- the measured values: voltage, current and power (the minor-axis in Panel-lingo)
Organizing the data in a Panel makes easy to look at different variables for individual houses
or compare the same variables across different houses. The most noticeable thing is that
we'll write just few lines of code to do this. This is one of the advantages of using Pandas!
A few "Pythonic" notes before diving into the script. I'll make use of two concepts that come handy: lambda functions and the map operator.
Let's go with an example for lambda functions
f = lambda x: x+1
f is a lambda function that is equivalent to
def f(x):
  return x+1
So lambda functions are just functions, but more convenient to be declared without writing too many lines of code.
Now let's see the map operator. The map operator maps the element of an iterable object (e.g., an array or a list) to an other. Imagine you have a list that contains power measurements in W, and you want to convert them to kW, you can do it with a map operator
values_W = [1000.0, 1200.0, 3050.0]
values_kW = map(lambda x: x/1000.0, values_W)
the results is
values_W = [1.0, 1.2, 3.05]
basically every value of the original list has been mapped via the lambda function to a new value (watts to kilowatts).
Now I suggest you to look at the script and how the data are processed. Below there are few images created by the script.
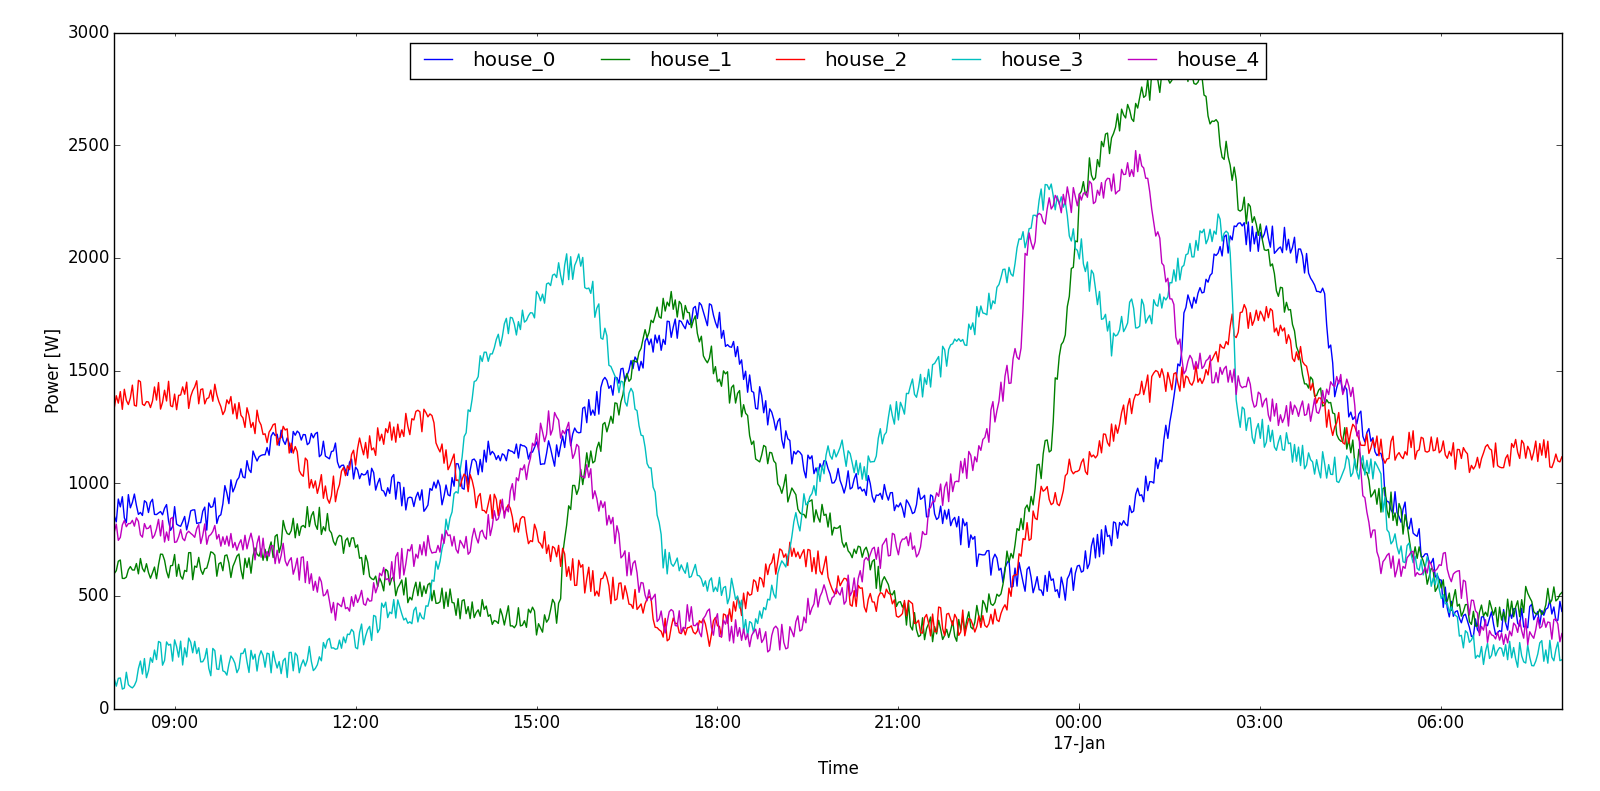
This plot shows the power consumption of the different houses over time period being analyzed.
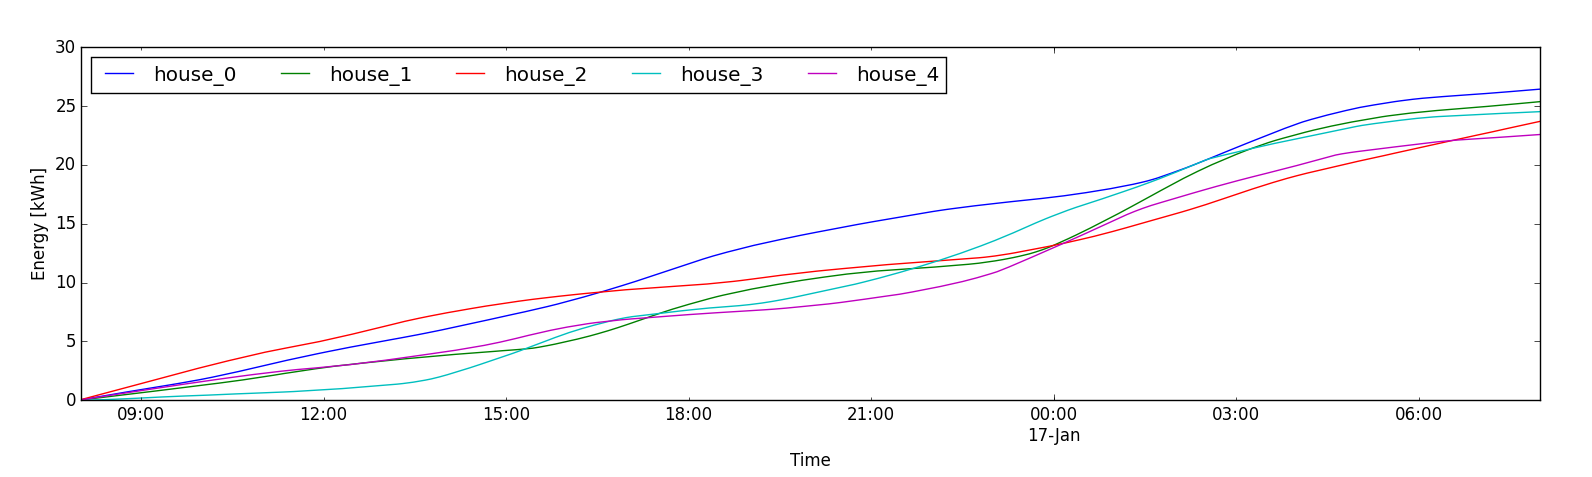
This plot shows the energy used by the different houses over the time period being analyzed.
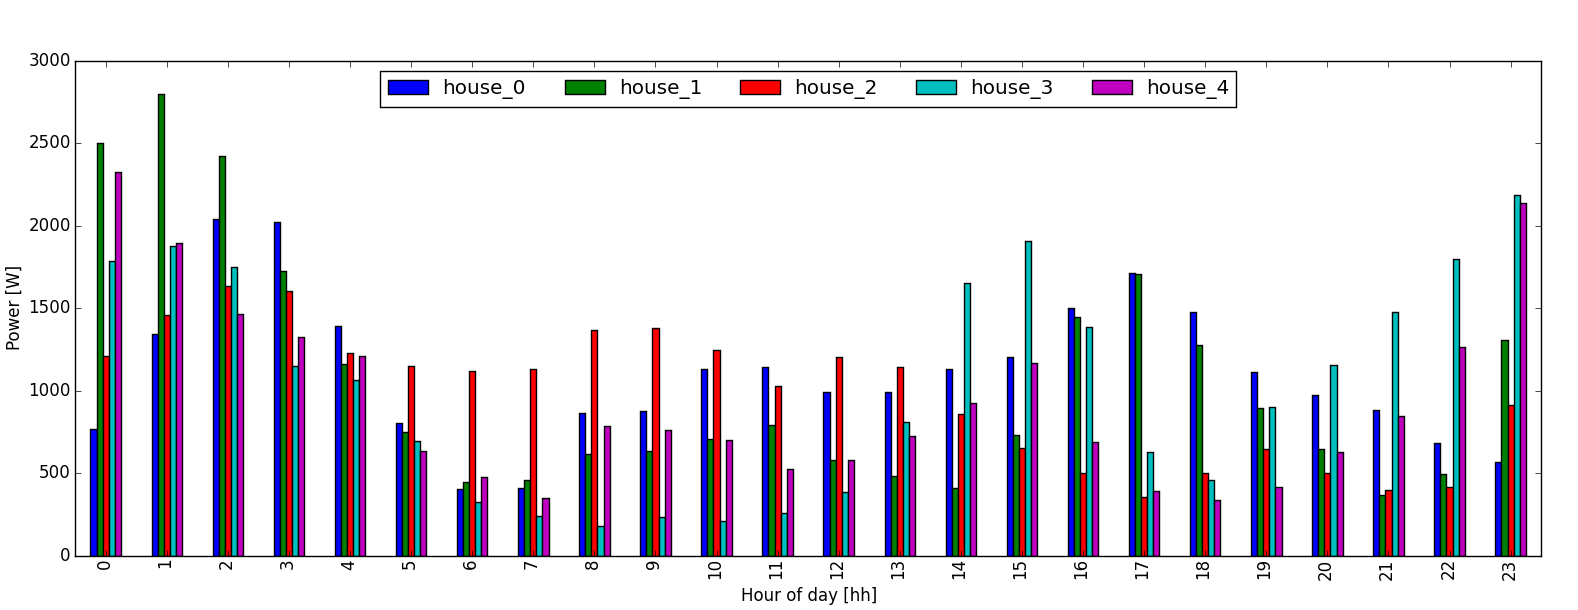
This plot shows the power consumption grouped by hour of the day. Such a plot can be helpful in identifying patterns of usage or hours when the loads are generally higher.
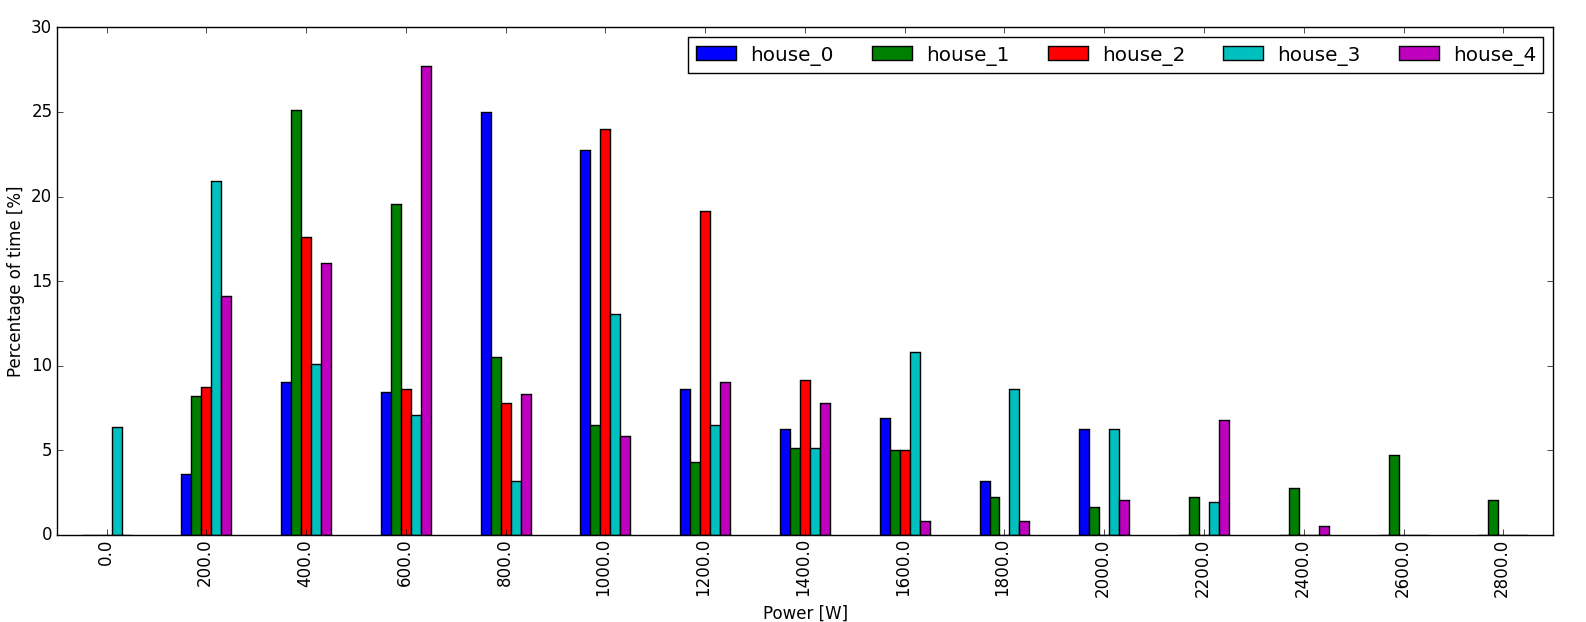
The load duration curve is a plot that help understand how much time is spent when the power consumption is in a certain range. Such a plot helps understand which operational conditions should be improved to obtain substantial savings.