The Trains Visualization
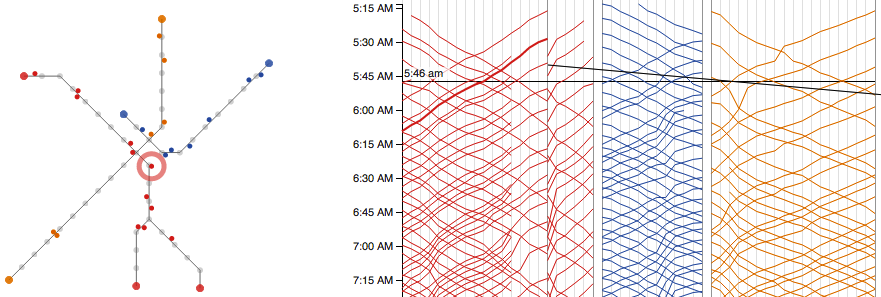
This section from Visualizing MBTA Data displays train locations over time
using a Marey diagram (also called a time-distance diagram). These diagrams are
sometimes difficult to interpret, so we place a map along-side that shows the
location of each train when you hover over a particular time in the Marey
diagram. We also add lightweight interaction that highlights the dot
representing a train when you hover over its line and vice versa - which also
serves to explain the diagram and reinforce the two levels of abstraction.
the-trains.js is responsible for rendering the full Marey diagram, the
lined-up Marey diagram which is displayed after this initial digram, the map glyph
showing train locations, and setting up interaction with surrounding text.
http://mbtaviz.github.io/#trains
This visualization requires 4 data files to render:
-
station-network.jsonnodes (stations) and links that represent the network topology of the subway system -
spider.jsonscreen placement for stations in order to render the map glyph -
marey-trips.jsonstation/timestamp sequence for each train trip rendered in the diagram -
marey-header.jsonordering of stations as vertical lines from left to right in the diagram
station-network.json and spider.json are described in
[Common Data Files](Common Data Files).
Contains the station/timestamp sequence for each train trip rendered in the diagram. Expected format:
[
  {
    "stops": [
      {
        "time": unix timestamp (in seconds) when the train reached this stop,
        "stop": "GTFS ID of this stop"
      }, other stops along this trip ...
    ],
    "begin": pre-calculated min time from stops list,
    "end": pre-calculated max time from stops list,
    "line": "name of the subway line this trip is on",
    "trip": "unique identifier for this trip"
  }, other trips in the marey ...
]
Contains the placement for lines representing stops along the marey diagram. Expected format:
{
  "GTFS station ID|line name": [
    x-position,
    y-position - not used
  ], other stops...
}
These are generated manually to control the layout.