ROUGH DRAFT
- Utilizing machine learning and ETL create a predictive model and illustrate using Tableau to forecast the probability of flooding from abrupt snowpack disinegration. Areas of focus; are cities within Salt Lake, Utah, Davis, and Weber Counties.
- Jupiter Notebook.
- Excel
- Machine Learning
- Tableau https://public.tableau.com/app/discover to Edit USERNAME shoessold0411@outlook.com PASSWORD Capita11Nas!
Extract the data parameters below for folllowing dates and locations PAST 10/01/1982 - 09/30/1983 | 10/01/2011 - 09/30/2011 | MEDIAN 10/01/1991 - 09/30/2020 | CURRENT/FUTURES 04/01/2023 - 05/31/2023. 4 types timeframes PAST, MEDIAN, CURRENT/FUTURES each coincedies with an timeset above.
DATA LOCATION Extraction are as follows, Salt Lake County zip codes and Station ID (Snowbird (84092, Thayne Canyon (84060), Mill-D North (84121)) | Utah County (Cascade Mountain (84604), Timpanogos Divide (84003), Hobble Creek (84663)) | Davis County (Farmington (84025), Farmington Lower (84037), Parrish Creek (84014)) | Weber County Ogden (84402), Hubbard (84135), Morgan (84050).
Consolidate 3 datasets into 1 data and make SQL schema.
- Precipation: PAST, CURRENT/FUTURES. (Melissa)
- Temperature: PAST, MEDIAN, CURRENT/FUTURES. (Melissa/Jane) FUTURES DONE.
- Snowpack levels: PAST, MEDIAN, CURRENT/FUTURES. DONE.
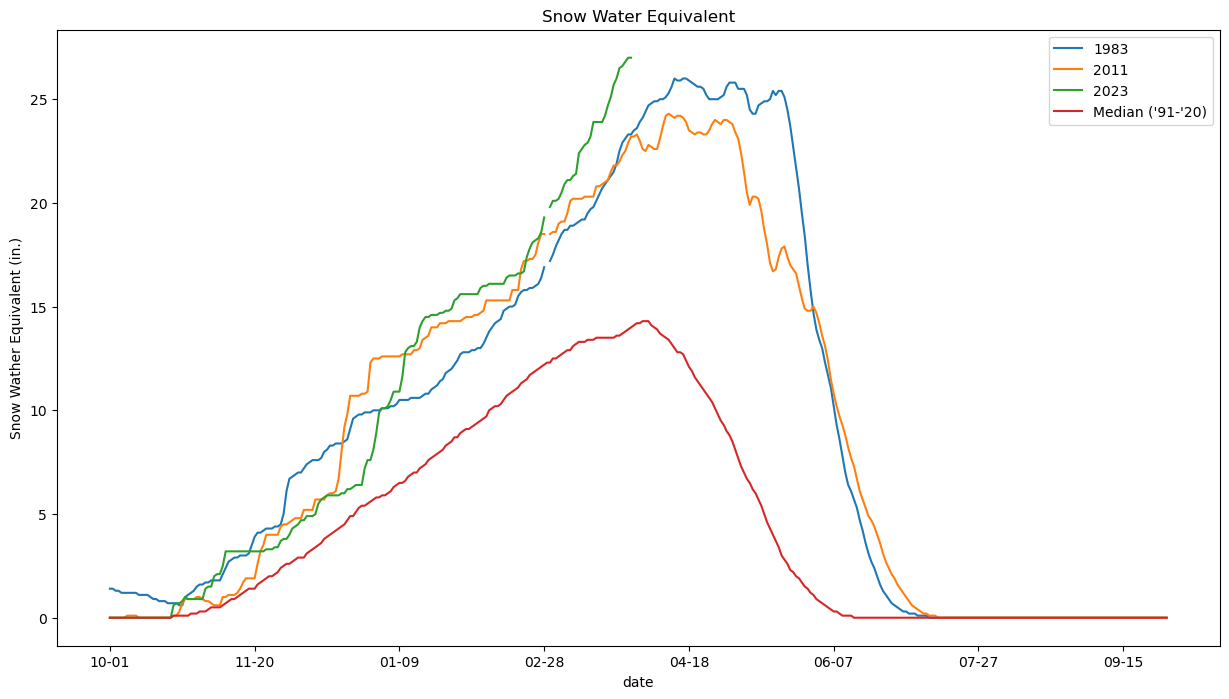
- Snow/Water equivilent: PAST, MEDIAN, CURRENT/FUTURES. DONE
- Stream Flow data. DONE.
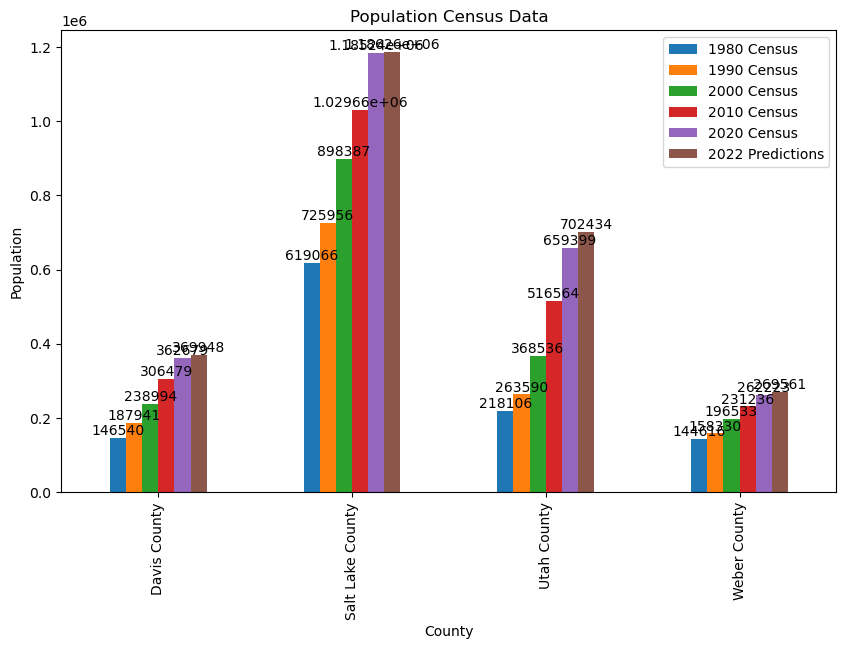
- Population DONE.
Snow Water Equivalent
Population Growth Chart
Population by County Heat Map

-
First step aggregate the data then merge the data into 6 columns. Assign by date, check and elminate duplicates and nulls.
-
Second clean the data find the correlation.
-
Third the outcome, logistical regression.
The data exhibits and extrapolates the plausibility of flooding in zip codes/real estate developments of high risk.
KEY SITES FOR TRANSFROMING, CLEANING https://pandas.pydata.org/pandas-docs/stable/reference/api/pandas.DataFrame.corrwith.html https://pandas.pydata.org/pandas-docs/stable/reference/api/pandas.DataFrame.corr.html
MACHINE LEARNING | TARGET VARIABLE IS TEMPERATURE-THIS ALLOWS ESTIMATING THE PACE, DISINEGRATION, and ENVIROMENTAL HAZARDS.
- Target variable is now temperature.
- Most likely used machine learning technique LOGISTICAL REGRESSION.
2022/2023 winter for Utah saw an unprecedented accumulation of snowfall which has created mammoth snowpacks throughout the state. This winter broke records. Drastic disintegration of Utah's snowpack can trigger various environmental hazards: rock slides, avalanches, and flooding. Specifically, focusing on populated areas that may be of higher risk than others; we hope to aid in mitigating and forecasting the probability of flooding from abrupt snowpack disintegration. The cities of focus are 12 zip codes within Salt Lake, Utah, Davis, and Weber Counties.
TECHNOLOGIES USED
ETL (Extract, Transform, Load) Jupyter Notebook Machine Learning Logistical Regression Tableau
DATASET
The data collected is historical data from 1983, 2011, median range of 1990-2020, 2023, and the next 30 days. The dataset includes the following 6 coloumns.
- Precipation(Snowfall): PAST, CURRENT/FUTURES. (Melissa)
- Temperature: PAST, MEDIAN, CURRENT/FUTURES. (Melissa/Jane) FUTURES DONE.
- Snowpack levels: PAST, MEDIAN, CURRENT/FUTURES. DONE.
- Snow/Water equivilent: PAST, MEDIAN, CURRENT/FUTURES. DONE
- Stream Flow data. DONE.
- Population DONE.
MACHINE LEARNING
Analyzing the dataset, a relevant and simple target variable presents itself, reservoir capacity. The historical dataset shows that when reservoir capacity is at peak levels during heavy precpitation years this factor among others supports the prediction that flooding may occur. Two other key points to consider when reservoir capacity increases to a full rate is the amount of Snow/Water Equivalency or (SWE). Definition, (Snow/water equivalent is the amount of liquid water in the snow. If you took a height of snow and melted it, the height of the water created is SWE. For example, if 10″ of snow falls at 10% density, then there would be 1″ of SWE. https://missoulaavalanche.org/). Lastly, is temperature. Flooding has occurred in the past when a drastic, consistent, and volatile change in temperature takes place. By coupling together reservoir capacity, severe temperature hikes, and large snow/water equivalent flow these key data points together and utilizing machine learning and leveraging the logistical regression model our hypothesis dictates that flooding may.......?
NOTES DURING PRESENTATION WORTH STATING (OPTIONAL)
*12-15 years of Drought, based upon logical analysis the flood water will FIRST fill ground water basins, wells, and the great salt lake-therefore, minmal flooding may occur.
*the melt rate may illustrate the probability of flooding. encapsulated this within a logistical regression model.
What are the stream cubic volume currently? What cities and counties are in line with a particular swelling in population to stream flow.
Target variable must show flood proof. Soil/moisture satuaration USDA website or historical proof Geological website.