Clarify N50, L50, metrics in anvi-display-contigs-stats #849
Comments
|
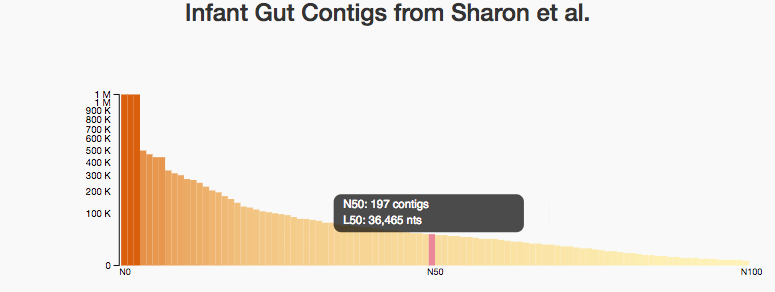
Hi @brymerr921, Thanks for the bringing this issue, yesterday we had a discussion about this and changed how we report N/L values on the plot little bit. Now it looks like this: Is it more clear and/or accurate like this? Do you have any suggestions? Best, |
|
@ozcan, this looks great! I didn't mention this before, but the original graphical version is actually what helped me make sense of things. This is still a great improvement though. Added clarification in the help at the command line for |
|
It appears that while N50 and L50 are sometimes used interchangeably, according to the official definition we have the terms swapped in anvi'o. To fix this we would just need to swap the labels N50 and L50 in So currently it looks like this: anvi'o reports N50 (and other N values) as a number of contigs. But it should look like this: anvi'o reports L50 (and other L values) as a number of contigs. I am really sorry about this, because I'm almost certain it was me who originally explained these concepts backwards while |
|
Ah. Someone else recently complained about this and I couldn't fix it. Can you fix it in the repository? |
|
@watsonar, here are some code pointers if you are still interested in this. for interactive plot: for text report: |
|
Thank you @ozcan! I believe I have fixed the problem now. |
Hi everyone,
I have a quick comment about
anvi-display-contigs-stats. I noticed that the N50 and L50 values returned byanvi-display-contigs-statswere different from other programs I have used (e.g. QUAST) and realized that they are just switched. From googling around it appears that they are (unfortunately) used interchangeably. I think it might be helpful to other users to clarify:anvi'o reports N50 (and other N values) as a number of contigs.
anvi'o reports L50 (and other L values) as a contig length.
(This makes sense to me, N=number, L=length)
For example, based on anvi'o reports, if the N50 of my contigs database is 22000 and my L50 is 5530bp, it means that 50% of my assembled data is contained in contigs larger than 5530bp. There are 22000 contigs larger than 5530bp.
For this same set of contigs, QUAST would report an N50 of 5530bp and an L50 of 22000.
The text was updated successfully, but these errors were encountered: