CPU spikes every 10 minutes due to accounts-base package clearing login tokens #10462
Comments
|
@wildhart Can you post a gist with your |
|
I’ve cloned my production db on my local machine and also a staging server identical to production. Neither exhibit the same spikes and the expireTokens interval only takes 20-150ms total. So it only appears to be a problem when users are connected (production server varies between 50-100 concurrent sessions, spikes are worse when there are more active sessions). |
|
If I was in your situation I would try adding some indexes to the users collection that have the tokens that are being checked for for in each of the 3 functions called in the accounts package and see if that reduces the times recorded for the update queries. I find that having a few thousand records in the users collection does cause a few problems. My other thought would be to clear the 50 tokens for a user when they logout. I have not noticed this pattern of token build up myself however. |
|
I've added an index to the I've expired all tokens older then 30 days and that helped a bit. I also figured out why I had so many tokens: a bug in my signIn.vue component was causing the <form @submit="submit>
...
<button @click="submit" type="submit">Sign in</button>was causing the Removing tokens over 30 days reduced the number of tokens by about half (1125 to 602) and the maximum number of tokens per user from 55 down to 26. Over time more of those older tokens should expire as well making things better. However, I'm still still getting significant spikes when the expire tokens interval runs. I've made a new discovery: One of my publications is also spiking every 10 minutes coinciding with the token expiry setInterval: My Meteor.publish("user_teams", function() {
if (this.userId) {
const result = Meteor.users.find(this.userId, {fields: {
teams: 1,
teamAdmin: 1,
view: 1,
set: 1,
superAdmin: 1,
"profile.name": 1,
userTour: 1,
hideHeader: 1,
loneWorkerAccepted: 1,
isLoneWorker: 1,
loneWorker: 1,
loneWorkerHistory: 1, // keep this separate so can send all of loneWorker to other users.
commsOptOut: 1,
devices: 1,
"mobile.number": 1,
"mobile.verified": 1,
notifications: 1, // a list of unacknowledged notifications
showConsole: 1,
} });
// console.log("meteor.publish user_teams", JSON.stringify(result.fetch()));
return result;
}
return [] ;None of these fields are being changed during the token removal updates (nothing is being changed because most of the time no old tokens are found to expire). So why would this publication be re-running for lots of users after the token expiry query? I'm using peerlibrary:reactive-publish by @mitar, but this publication isn't using an autorun. |

|
@wildhart Can you tell if that publication is using the Polling or Oplog driver? |
|
@nathan-muir it was using Polling, because I had deployed with mup without enabling the oplog at all. I've since redeployed with oplog enabled. The user_teams publication now looks like this (redeployed at 16:03): There is still a spike in overall fetched documents every 10 min:
and still a small spike in CPU:
both coinciding with the token expiry, but much less than before. Overall CPU is down. |


|
Yeah, thought it was polling. When using the polling driver, When using oplog driver, it will only fetch the modified documents (from the oplog) and then see if the doc matches any of the active publications (which can be done in nodejs for simple publications) [1] Technically the polling driver will re-query every instance of |
|
Thanks for your help. I'm happy to consider this issue closed but will leave it to a Meteor Dev to close because I still think that, given that the expire tokens setInterval does have a noticible impact on performance, (albeit quite small if oplog is enabled), I think it excessive that the interval is set to every 10 minutes when the If that's unlikely to be changed then go ahead and close this issue. |
|
This issue has been automatically marked as stale because it has not had recent activity. It will be closed if no further activity occurs. Thank you for your contributions. |
|
This issue has been automatically closed it has not had recent activity. |
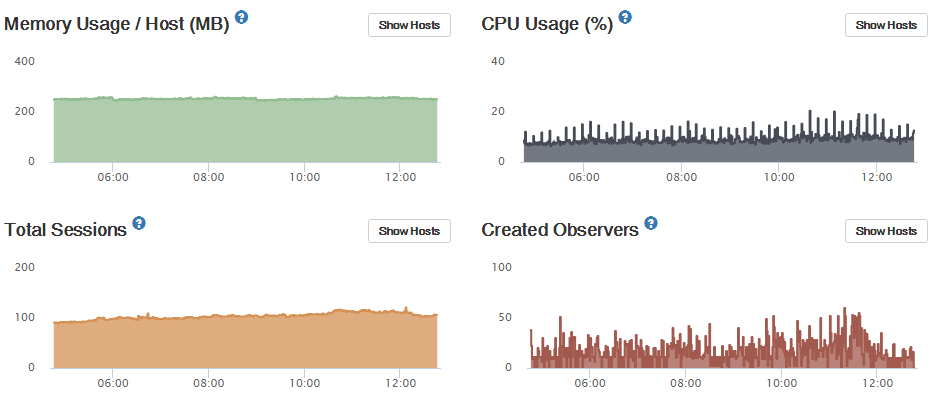
I have a single combined meteor server and MongoDB (I know, but it's appropriate to the size of my app for now), and precisely every 10 minutes I see a CPU spike:
I'm currently using Meteor 1.8.1-beta.17 but this has been happening for a long while now and unfortunately I can't remember in which version of Meteor it started happening. Nor can I revert my production server to old releases to find out, sorry.
I've tracked it down to the following code in
accounts-base/accounts_server.js:I've proved this code is the culprit by changing
EXPIRE_TOKENS_INTERVAL_MSto 15 minutes instead of 10 minutes and the spikes change accordingly.To see how long this code is taking and how many tokens are removed I modified the code to:
This gives the following output:
Since node and mongo are running on the same server, I tracked the CPU usage of each using htop during one of these intervals:

accounts._expireTokens()seems to be the worst offender of the three functions within the interval.My users collection only contains 946 users, and 407 of these contain "
services.resume.loginTokens.when", but none of those tokens are over 90 days old. However, most of them contain multiple loginTokens (up to 50 in some cases).When I run a similar query direct in the mongo shell using
.explain("executionTime")it takes only a couple of milliseconds and reports that it is using an index.Since the query should be fast, the working hypothesis on this thread in the Meteor forums is that the
collection.update()function is yielding to another fiber, but I don't know how to track down which other code is causing the delay, or why it would only be happening only during these regular queries. No user documents are being updated so I don't think it can be an observer on the Meteor.users collection.Meteor is deployed to Digital Ocean on an Ubuntu server. Sorry I can't produce a repro - the CPU spike is only apparent on my production server.
Any ideas what could be causing the CPU spike?
Also a side question - since the
DEFAULT_LOGIN_EXPIRATION_DAYS,DEFAULT_PASSWORD_RESET_TOKEN_EXPIRATION_DAYSandDEFAULT_PASSWORD_ENROLL_TOKEN_EXPIRATION_DAYSperiods are 90, 3 and 30 days respectively, why is the default interval running every 10 minutes?The text was updated successfully, but these errors were encountered: