The current Repo houses codes for the analysis of Mints Lora Nodes. The repo is divided into 3 sections:
- Data Processing
- Time Series Representations
- Calibration
The data processing section is designed to download and concatinate data files of individual nodes.
The code needs rsync installed on your PC.
sudo apt install rsync grsync
The host computer should have access to mints@mintsdata.utdallas.edu:raw. This will be provided upon request.
rsync -avzrtu --exclude={"*.png","*.jpg"} -e "ssh -p 2222" mints@mintsdata.utdallas.edu:raw/b827ebf74482/ /media/teamlary/teamlary3/air930/mintsData/b827ebf74482/
(b827ebf74482 is the gateway ID for this example)
Once access is granted to mints@mintsdata.utdallas.edu:raw the YAML(mintsDefinitions.yaml) file needs to be modified. The directory structure in which the files are situated is given below.
── loraMintsML
│   ├── firmware
│   │       ├── mintsDefinitions.yaml
│   │   └── dataProcessing
│   │       ├── L0001_raw2Mat.m
Please choose a directory where you need to create the mints data files with the name 'mintsData'. Make sure to keep a common 'mintsData' for all MINTS Projects. Then point to the said folder on the yaml file under the label 'dataFolder'. In most Mints Data packages are resampled within a pre defined period for synchronizing multiple data samples. For Lora sensor data and mints other MINTS Air Monitoring data sources its fit to resample to a period of 30 seconds. As such 30 can be put under timeSpan. Under the gatewayIDs list, type in all the Lora Gateway IDs present. After registering each Lora node on the Gateways, list them down under the loraIDs field on the YAML file. The rest of the fields present are for the lora Data calibration purposes. Since the YAML file is shared by all the sections present, its put under the firmware folder. If needed unique YAML file can be used for each section. An example YAML File is given below.
dataFolder: "/media/teamlary/teamlary3/air930/mintsData"

timeSpan: 30

gatewayIDs:
    - "b827eb60cd60"
    - "b827eb52fc29"
    - "b827ebf74482"
    - "b827eb70fd4c"

loraIDs:
    - "475a5fe3002e0023"
    - "475a5fe3002a0019"
    - "475a5fe3003e0023"
    - "475a5fe30031001b"
    - "475a5fe300320019"
    - "475a5fe300380019"
    - "477b41f200290024"
    - "475a5fe3002e001f"
    - "477b41f20047002e"
    - "475a5fe30021002d"
    - "475a5fe30031001f"
    - "475a5fe30028001f"
    - "478b5fe30040004b"
    - "472b544e00250037"
    - "47eb5580003c001a"
    - "47db5580001e0039"
    - "479b558000380033"
    - "472b544e00230033"
    - "478b558000330027"
    - "475a5fe30035001b"
    - "472b544e0024004b"
    - "470a55800048003e"
    - "475a5fe3002a001a"
    - "47cb5580003a001c"
    - "475a5fe300300019"
    - "475a5fe3002e0018"
    - "472b544e0018003d"
    - "476a5fe300220022"
    - "472b544e001b003c"
    - "47bb558000280041"
    - "47db5580002d0043"
    - "477b41f20048001f"
    - "47fb558000450044"
    - "475b41f20037001e"
    - "478b5fe30040004b"
    - "475a5fe30039002a"
    - "479b5580001a0031"
    - "475a5fe3002f001b"
    - "47cb5580002e004a"
    - "471a55800038004e"


airmarID: "001e0610c0e4"

deployments:
    "477b41f20047002e": "2020-08-20 00:00:00"
    "472b544e00250037": "2020-08-20 00:00:00"

binsPerColumn  : 400
numberPerBin   : 2
pValid         : 0.15
Once the YAML file is updated you can run the ' L0001_raw2Mat.m' file under matlab (Make sure you point to the proper YAML file on the matlab script). This should result in creating unique .mat files for each node which concatinates all lora data belonging to that node. The said files can be found within the folder structure described below.
── mintsData
│   ├── rawMats
│   │   └── lora
│   │             ├── loraMints_470a55800048003e.mat
│   │             ├── loraMints_472b544e0018003d.mat
│   │             ├── loraMints_472b544e001b003c.mat
│   │             ├── ...
The 'loraMints_--loraID--.mat' files contains the folowing data attributes.
- NH3 : Ammonia NH3 1 – 500ppm
- CO : Carbon monoxide CO 1 – 1000ppm
- NO2 : Nitrogen dioxide NO2 0.05 – 10ppm
- C3H8 : Propane C3H8 >1000ppm
- C4H10 : Iso-butane C4H10 >1000ppm
- CH4 : Methane CH4 >1000ppm
- H2 : Hydrogen H2 1 – 1000ppm
- C2H5OH : Ethanol C2H6OH 10 – 500ppm
- P1_lpo : Channel 1, Low Pulse Occupancy Time Per 15 Seconds
- P1_ratio : (Channel 1, Low Pulse Occupancy Per Milli Second)/10
- P1_conc : Concentration PM Mid range (between PM 2.5 and PM 10) in Particles per .01 cubic foot ~= particles per 283 milli Litres
- P2_lpo : Channel 2, Low Pulse Occupancy Time Per 15 Seconds
- P2_ratio :(Channel 2, Low Pulse Occupancy Per Milli Second)/10
- P2_conc : PM10 Concentration in particles per .01 cubic foot ~= particles per 283 milli Litres
- Temperature : -40 - 85 ℃, with ±1.0°C accuracy - From the SEEED BME280 Sensor
- Pressure : 300 - 1100 hPa (1 hPa= one hundred Pa) with ±1.0 hPa accuracy
- Humidity : 0% - 100% relative humidity , with ±3% accuracy - From the SEEED BME280 Sensor
- gpsTime : NaN Value
- Latitude : Degrees Latitude
- Longitude : Degrees Longitude
- shuntVoltageBat : Shunt Voltage for the Battery in Millie Volts
- busVoltageBat : Bus Voltage for the Battery in Volts
- currentBat : Current sent from the Battery in Millie Amps
- shuntVoltageSol : Shunt Voltage for the Solar Panel in Millie Volts
- busVoltageSol : Bus Voltage for the Solar Panel in Volts
- currentSol : Current sent from the Battery in Millie Amps
- CO2 : 0 - 40’000 ppm ± (30 ppm + 3%) - From the SEEED SCD30 Sensor
- SCD30_temperature : Temperature (C) - From the SEEED SCD30 Sensor
- SCD30_humidity : Humidity (%) - From the SEEED SCD30 Sensor
Each lora node houses separate sensors. To check on specific sensors a seprate code is done to plot graphs on each sensor. An example is given below.
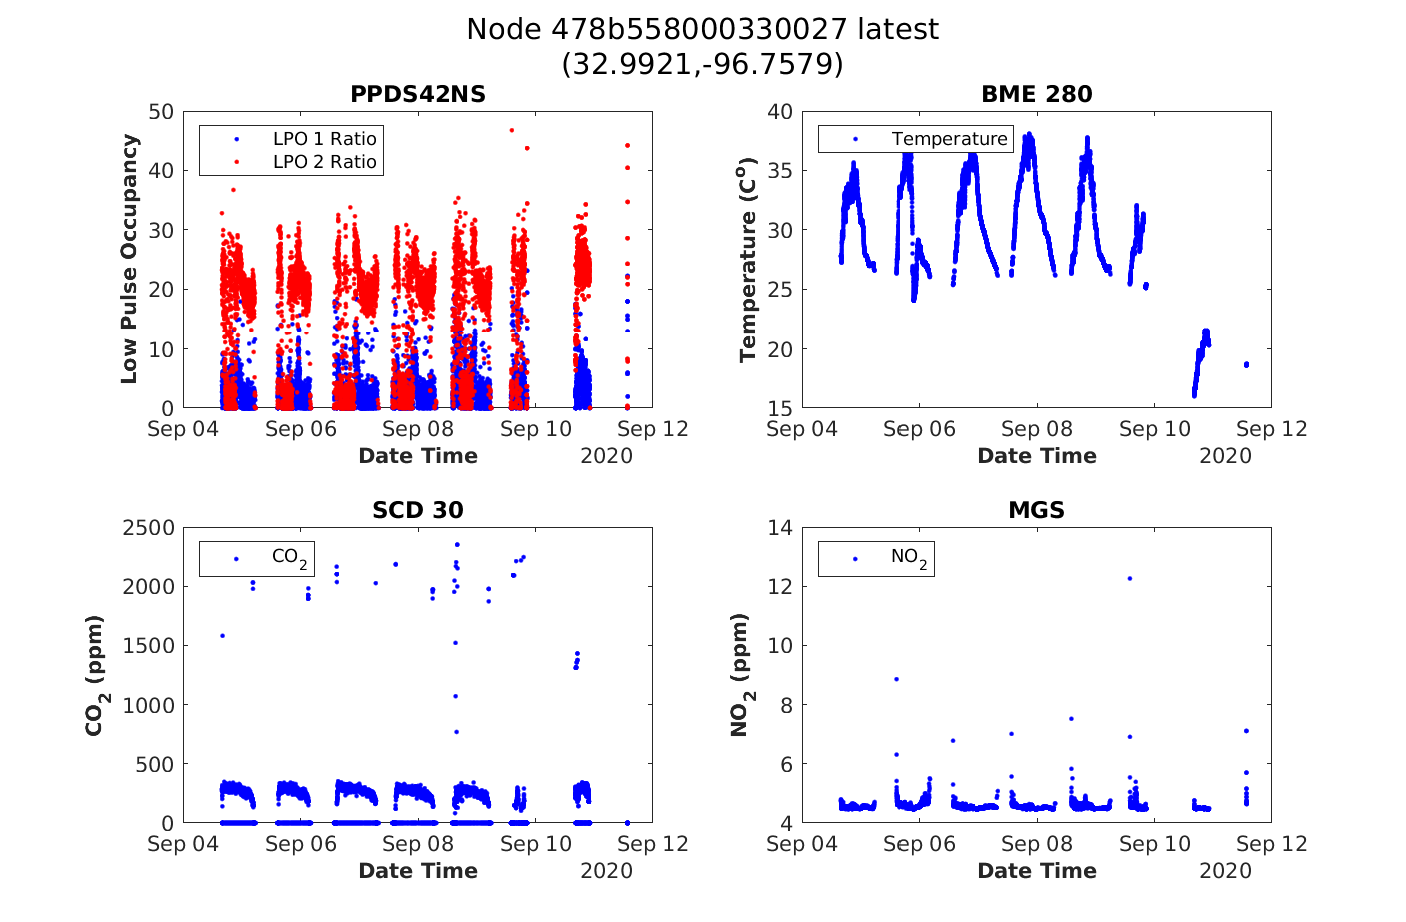
Once you run L0001_raw2Mat.m go ahead and run L0002_rawPlots.m. It creates two figures for each individual sensors. The first one is just for the last weeks data (Under the token latest) and the other one is for the whole time that the sensor is running (Under the token spanned). The figures will appear under the following folder structure.
── mintsData
│   ├── visualAnalysis
│   │   └── lora
│   │         └── spanned
│   │                   ├── loraMints_470a55800048003e_spanned.png
│   │                   ├── loraMints_471a55800038004e_spanned.png
│   │                   ├── .......
|   │         └── latest
│   │                   ├── loraMints_470a55800048003e_latest.png
│   │                   ├── loraMints_471a55800038004e_latest.png
│   │                   ├── .......