Customizing data sources
The textures and models used to render the map are spatially organized into Mercator tiles.
 |
|---|
| Bing Maps tile system |
This coordinate system and projection are defined by EPSG:3857. This is a pseudo-Mercator projection used commonly by tile-based web mapping applications and services.
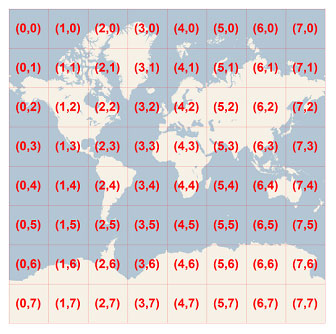
The tiles used by this system are square in the pseudo-Mercator projection space. Tiles are organized into levels of detail, which can be easily mapped to a "zoom level". As the zoom level increases, the number of tiles that cover the world increases. The level of details used by this map range from 2 to 20, where 20 is the highest level of detail.
 |
|---|
| Tiles and levels of detail |
This is essentially a quad-tree data structure. As such, it provides a simple and quick way to look up which tiles are relevant to a given map's extents and zoom level.
A tile can be identified in two ways: The TilePosition represents an x,y position and level of detail.
The TileId encodes this identifier into a single integer, a more compact representastion. The two representations can be converted between as needed.
The MapRenderer displays data from various sources, two of which are customizable: textures and elevations.
The tile layer system provides a way to supplement and/or overlay your own tiled data sources in place of the defaults source used by the map. A common example of this would be overlaying weather radar data.

In addition, the TileLayer system supports supplementing your own heightmap elevation data which may be derived from LIDAR sources or drone capture.
The specifics of each tile layer system are described in more detail here: