Psi Studio
Visualization of multimodal streaming data plays a central role in developing multimodal, integrative-AI applications. Visualization scenarios in \psi are enabled by the Platform for Situated Intelligence Studio, (which we will refer to in short as PsiStudio). The tool allows you to create complex visualization layouts, using multiple visualizers for streams of different types (from simple streams of doubles to 2D images, 3D depth maps, etc.).
This tutorial can help you get started with visualizing aspects of PsiStudio. For more information regarding data annotation, please see the Time Interval Annotations tutorial. An additional useful resource for learning how to use PsiStudio is this video tutorial presented during the April 2021 Platform for Situated Intelligence workshop.
The tutorial below is structured in the following easy steps:
- Building Platform for Situated Intelligence Studio - describes how to build PsiStudio.
- Creating an Example Store - we create the store that we will use in the remainder of the tutorial.
- Offline Visualization - explains how to visualize an existing store.
- Data Playback - explains how to playback streams.
- Live Visualization - shows how to visualize streams in real time.
Currently, PsiStudio runs only on Windows, although it can visualize data stores created by \psi applications running on any platform supported by .NET Core.
The tool is not currently shipped as an executable, so to use it you will need to build the \psi codebase; instructions for building the code are available here. The PsiStudio tool is implemented by the Microsoft.Psi.PsiStudio project in the Psi.sln solution tree under Sources\Tools\PsiStudio. To run it, simply run this project after building it.
For this tutorial we're going to create a project to generate a store that contains some simple waveform streams, and also streams for video, audio, and voice activity detection. To get the best out of this sample you'll need a webcam, but if you don't have one you can comment out the code below that references the MediaCapture, AudioCapture, and SystemVoiceActivityDetector components. You'll also need to be running Windows on a x64-based processor.
Create a new .NET Framework console app by going to File -> New Project -> Visual C# -> Console App (.NET Framework). Once you have created the project, add the following NuGet references to it. Make sure the Include prerelease checkbox is checked in NuGet Package Manager:
Microsoft.Psi.RuntimeMicrosoft.Psi.Media.Windows.x64Microsoft.Psi.Imaging.WindowsMicrosoft.Psi.Speech.Windows
Because this project uses components which are only available for the x64 processor architecture, we need to modify the project build settings to reflect this. Right-click on your project, select Properties, then go to Build. Change the Platform target from Any CPU to x64. Do this for both Debug and Release configurations.
Now replace all of the existing using statements at the top of your class with the following:
using System;
using Microsoft.Psi;
using Microsoft.Psi.Audio;
using Microsoft.Psi.Imaging;
using Microsoft.Psi.Media;
using Microsoft.Psi.Speech;
And finally, replace the body of your Main() method with the following:
// Create the pipeline object with diagnostics enabled
using (var p = Pipeline.Create(enableDiagnostics:true))
{
    // Create the store
    var store = PsiStore.Create(p, "demo", "c:\\recordings");

    var sequence = Generators.Sequence(p, 0d, x => x + 0.1, 10000, TimeSpan.FromMilliseconds(100));

    var sin = sequence.Select(t => Math.Sin(t));
    var cos = sequence.Select(t => Math.Cos(t));

    // Write the sin and cos streams to the store
    sequence.Write("Sequence", store);
    sin.Write("Sin", store);
    cos.Write("Cos", store);

    // Create the webcam and write its output to the store as compressed JPEGs
    var webcam = new MediaCapture(p, 1920, 1080, 30);
    webcam.Out.EncodeJpeg(90, DeliveryPolicy.LatestMessage).Write("Image", store);

    // Create the AudioCapture component and write the output to the store
    var audio = new AudioCapture(p, new AudioCaptureConfiguration() { Format = WaveFormat.Create16kHz1Channel16BitPcm() });
    audio.Write("Audio", store);

    // Pipe the audio to a voice activity detector and write its output to the store
    var voiceActivityDetector = new SystemVoiceActivityDetector(p);
    audio.Out.PipeTo(voiceActivityDetector);
    voiceActivityDetector.Out.Write("Voice Activity", store);

    // Write the diagnostics stream to the store
    p.Diagnostics.Write("Diagnostics", store);

    // Run the pipeline
    p.RunAsync();

    Console.WriteLine("Press any key to finish recording");
    Console.ReadKey();
}
As you can see from the code, we create several sinple waveform streams; sequence, sine, and cosine, and we also create a MediaCapture component whose output stream is encoded as JPEG images and then persisted to the store. In addition, we create an AudioCapture component whose output is similarly persisted to the store, and we pipe the output of the audio stream into a voice activity detector whose output is persisted to the store as yet another stream. Finally, notice that when we created the pipeline we set the optional enableDiagnostics parameter to true. This tells the \psi runtime to generate a stream that collects diagnostics information, and which, as we shall see, can also be visualized. We write out the diagnostics stream to our store as well.
Now start your application, let it run for thirty seconds or so while standing in front of the camera and talking, then press any key to stop recording and exit.
Now start up PsiStudio. You will see a window that looks similar to the image below. To open a store, go to the File -> Open Store and navigate to the location you have specified in the example above, e.g. C:\recordings\demo.#### (the last folder corresponds to the last run) and open the Catalog file, e.g. C:\recordings\demo.####\demo.Catalog_000000.psi. The PsiStudio window should now look like this:
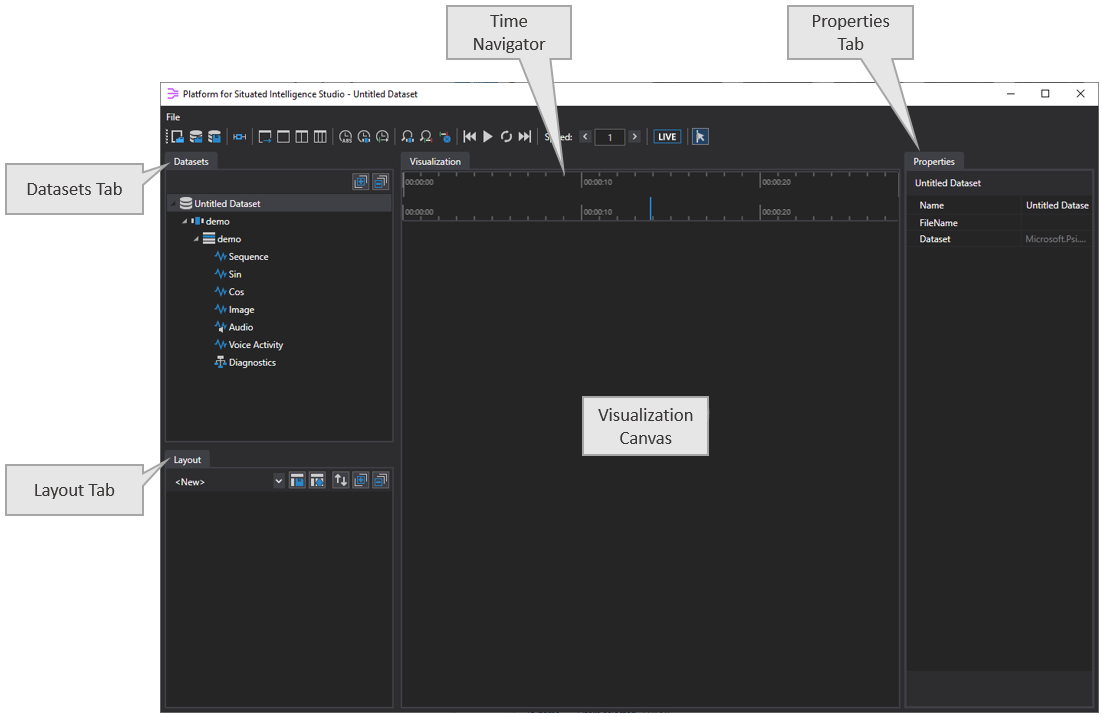
The PsiStudio application has a toolbar, a time-navigator (more on that in a second) and a visualization canvas in the center. On the left hand side, you will find the Datasets tab at the top with the Layouts tab below it. On the right hand side is a Properties tab that lets you view the properties of any object selected in either the Datasets or the Layouts tab. When opening a store, PsiStudio automatically wraps a dataset around it (in general datasets can contain multiple stores; more information on datasets is available in the Datasets page), with the name Untitled Dataset. Underneath the newly created dataset, a single session named Demo was also created, representing all of the data stores related to a single run of the \Psi application. A session can contain any number of partitions,each representing a store. In this case we have a single partition named Demo that corresponds to the store we just created. Notice that this partition contains the set of streams available in the store: Sequence, Sin, Cos, Image, Audio, Voice Activity, as well as the Diagnostics stream.
To visualize one of the streams, simply drag it from the Datasets tree onto the Visualization Canvas. If you drag the Sin stream into the Visualization Canvas you should see it displayed there. There can be any number of ways you might wish to visualize the data in a stream, and directly dragging the stream into the Visualization Canvas will result in the default visualizer being used. If you right-click on the Sin stream in the Datasets tree, a context menu will pop up with a list of other ways you can visualize it. For all streams you will see the Visualize Messages in New Panel menu item to visualize just the points in time where each message exists, and the Visualize Latency menu item to display the message's latency from input to output.
Once you've dragged the Sin stream into the Visualization Canvas, PsiStudio should now look like this:
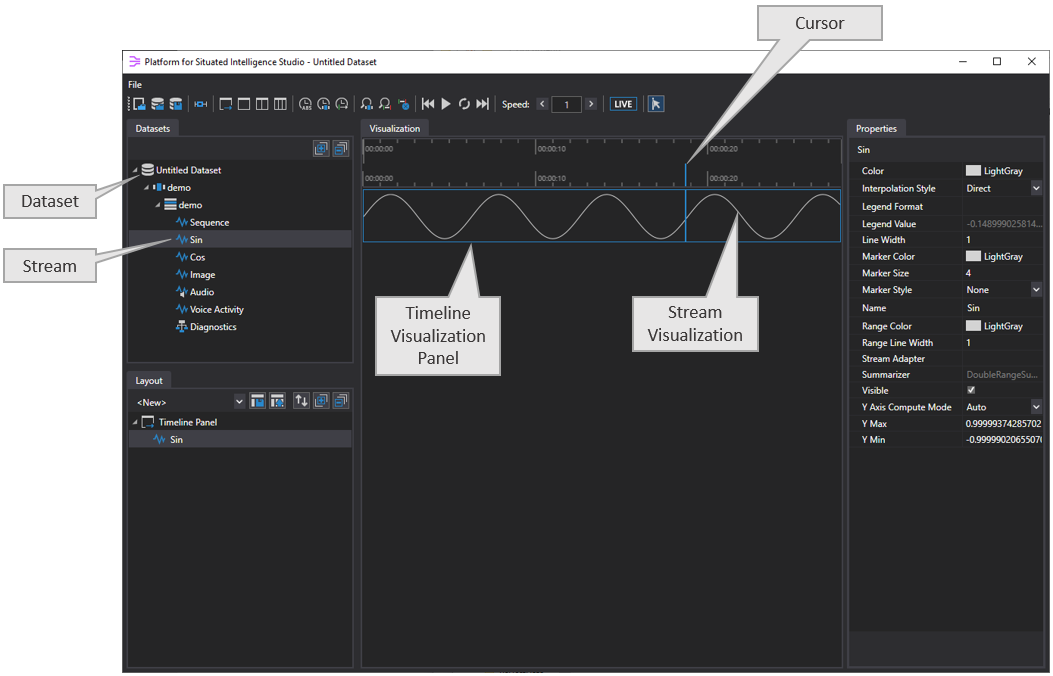
A timeline panel has been created, and inside there is now a visualizer for the Sin stream. Moving the mouse over the panel moves the data cursor (which is synchronized across all timeline panels).
If we repeat the operation on the Cos stream, a visualizer for this stream will be overlaid on the current timeline panel, resulting in a visualization like this:
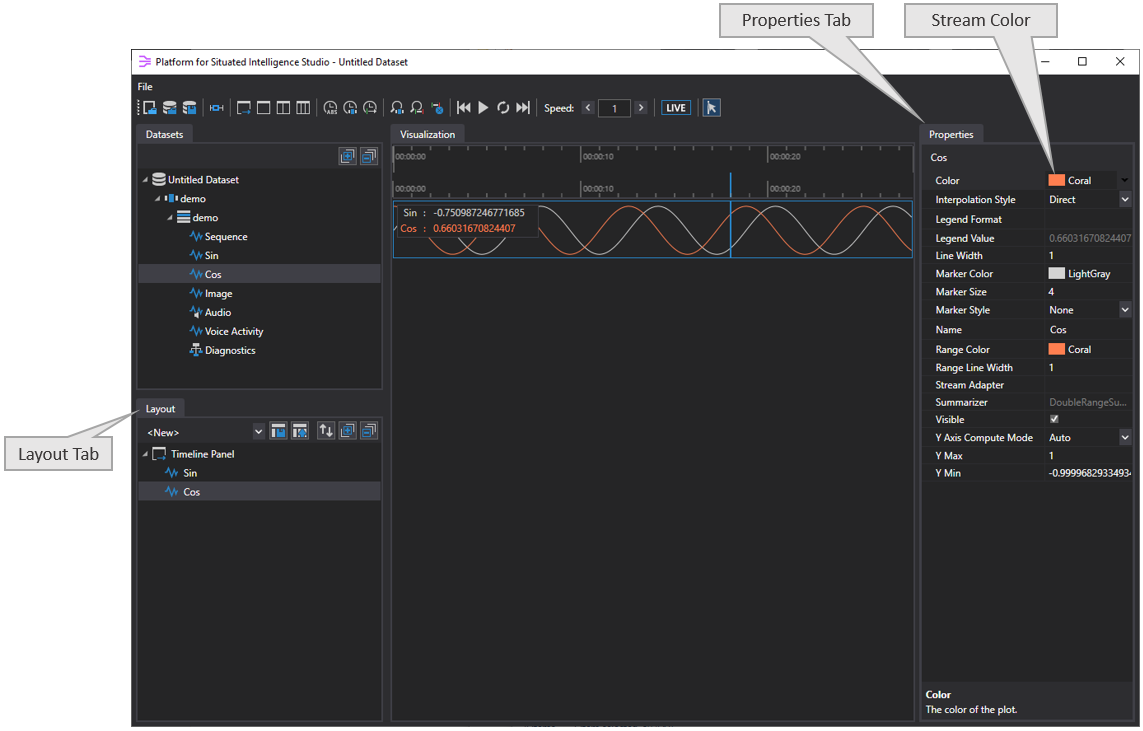
To display the legend that's visible in the image above, simply right click on the timeline panel and select Show/Hide Legend. We've also changed the Cos stream's Color property to Coral so that we can differentiate it from the Sin stream (more on properties in a second).
You will notice that as you move the cursor around over the timeline panel, the legend updates with the current values under the cursor. Navigation can be done via mouse: moving the mouse moves the cursor, and the scroll wheel zooms the timeline view in and out. As you zoom in, you will notice that the time navigator visuals change, to indicate where you are in the data (the blue region in the top-half). You can also drag the timeline to the left or right to view earlier or later data in the stream.
As we have seen before, new visualizations will by default be overlaid in the same panel. Suppose however that we wanted to visualize the Cos stream in a different panel. Take a look at the Layout tab on the left, notice that currently there is one timeline panel in the canvas that contains two stream visualizers underneath, for Sin and Cos, like below:
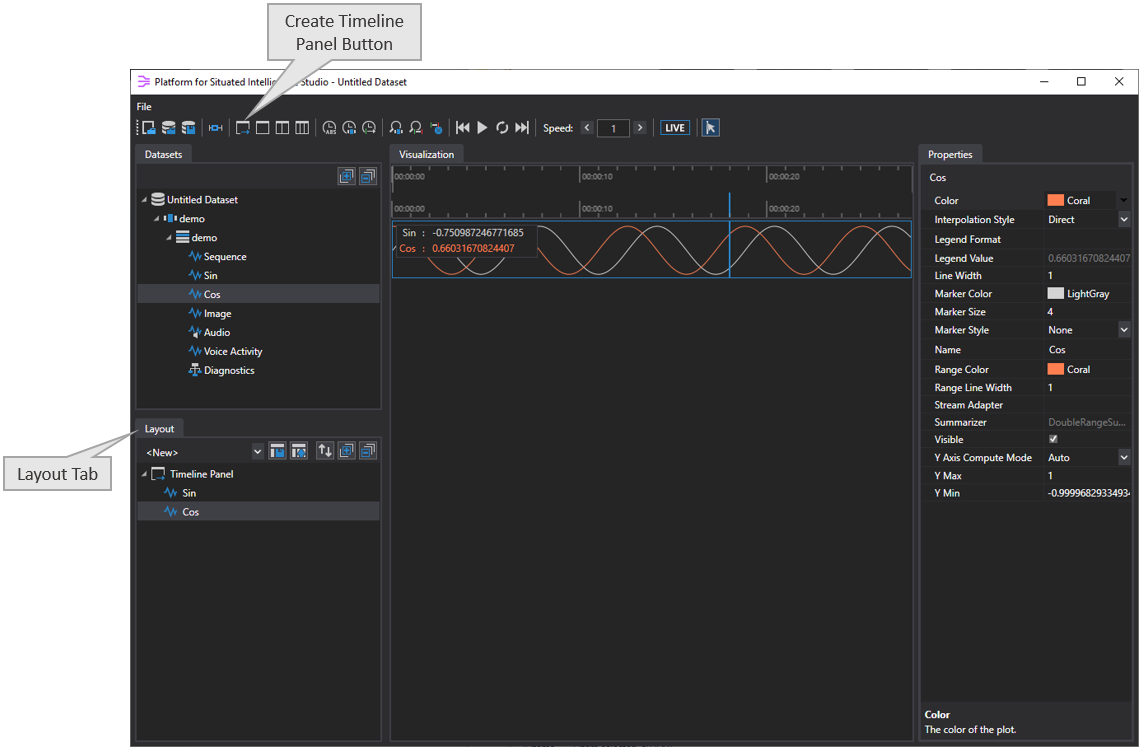
Right-clicking on the Cos visualizer brings up a context-menu that allows you to remove this visualizer. Try it out. This should make the Cos stream disappear from the panel. Next, click on the Insert Timeline Panel button in the toolbar, highlighted in the image above. This will add a new timeline panel. Then, in the Datasets tab, right-click on Cos and click Plot again, the Cos stream will appear in the second (current) panel. Alternatively, you can add a stream to a new panel by dragging it from the Datasets tab into any part of the Visualization Canvas that does not already contain a Visualization Panel.
You can use the mouse to drag the bottom edge of any visualization panel to change its height, and you can change the ordering of the panels by clicking inside any visualization panel and dragging it up or down.
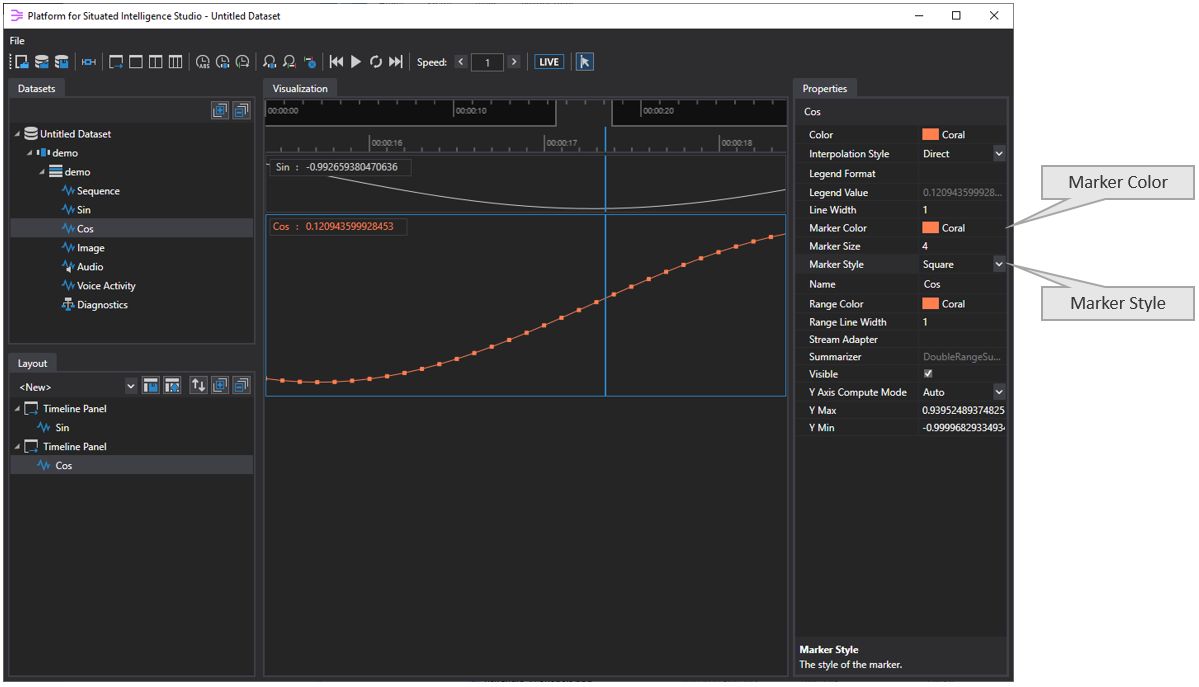
Come back to the Visualizations tab and highlight the Cos visualizer. In the Properties tab on the right the set of properties for this visualizer are available for inspection and modification. You can change various properties of the visualizer, like the color of the line and the marker style to use. For instance, here we have changed the LineColor and MarkerColor properties to Coral, and the MarkerStyle to Square:
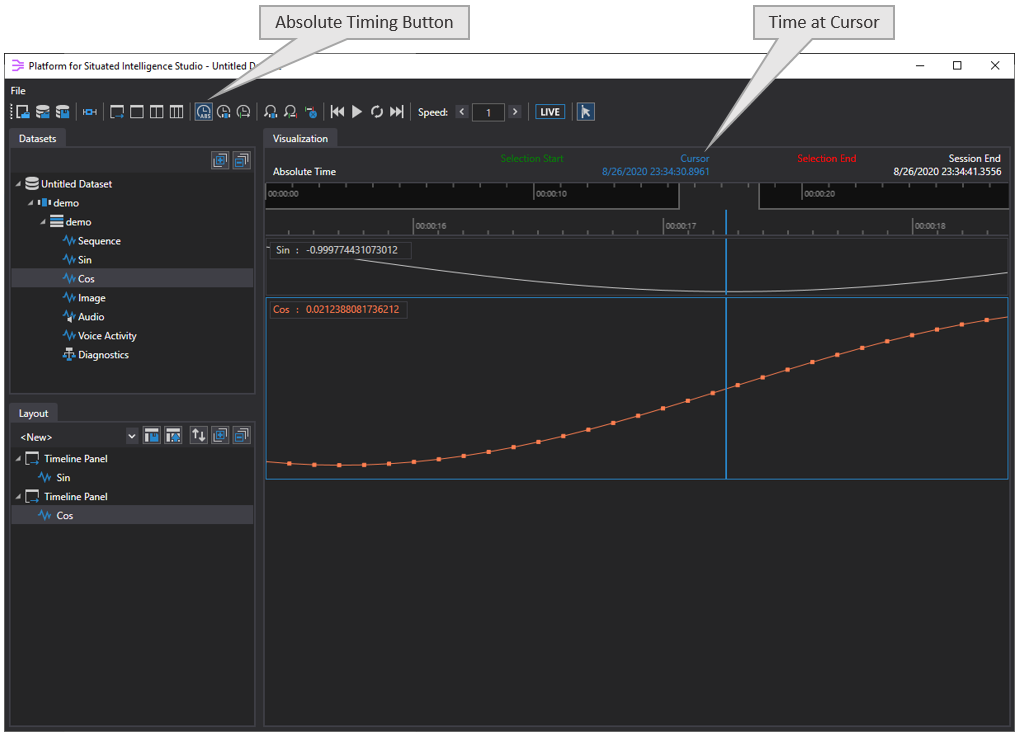
On the toolbar are three Timing Display buttons that can be used to display timing information above the Time Navigator. The first button displays absolute times, the second displays times relative to the start of the session, and the third button displays times relative to the selection start marker (selection markers are described in the Data Playback section below). The picture below shows what the PsiStudio application with just the absolute timing displayed. As the user moves the cursor within the navigation area, the timing display is updated to show the time at the cursor, the time relative to the selection start and selection end markers, and the time relative to the end of the session.
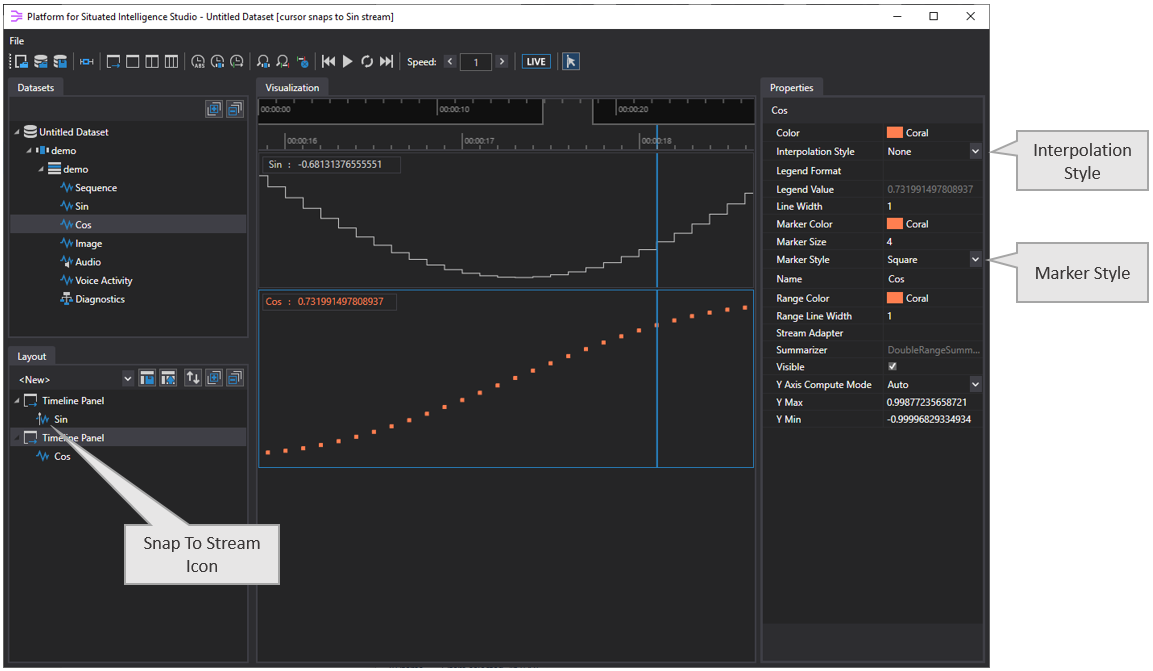
You can also change how a stream is rendered. In the picture below the Interpolation Style property of the Sin stream has been changed to Step which renders the stream so that it maintains its current value until the next message is received. For the Cos stream the Interpolation Style property has been changed to None so that only the values of the messages are displayed and no connecting lines are drawn between them. When using this valule for Interpolation Style the Marker Style property must be changed to something other than None or nothing at all will be rendered. Notice in the picture below that the Visualization Panel for the Sin stream has been resized by dragging its bottom edge in order to get a better view of the data.
Notice also that Snap to Stream has been enabled on the Sin stream so that the Cursor always snaps to the message nearest to the mouse. Snapping to a specific stream makes the cursor jump only between the originating times of the messages in that stream, allowing the user to easily find out timing information about the messages in that stream. To enable Snap to Stream, right-click the stream you wish to snap to in the Visualizations tab and select Snap to Stream in the context menu. The stream that is currently being snapped to will display a slightly different icon next to it in the Visualizations tab. To cancel Snap to Stream, right-click the stream in the Visualizations tab and again select the Snap to Stream menu item.
In PsiStudio you can not only view data streams, you can also play them back at whatever speed you choose. This can be useful for instance for viewing output that contains video streams, or listening to captured audio.
Remove the two existing timeline panels by right-clicking each of them in the Layout tab and selecting Remove from the context menu. Now drag Audio stream onto the visualization canvas to create a visualization of it and also drag the Voice Acitvity stream into the same timeline panel. Notice that having two related streams in the same visualization panel makes it easy to see how they relate to each other; overlaying the voice activity detection stream over the audio, we can see at a glance that the VAD is correctly identifying speech regions.
In the Datasets tab, right-click on the Image stream and select Visualize in New Panel from the context menu to display the video stream. Alternatively, you can simply drag the image stream from the Datasets tab into an empty area on the Visualizations Canvas. Your PsiStudio window should now look similar to the picture below.
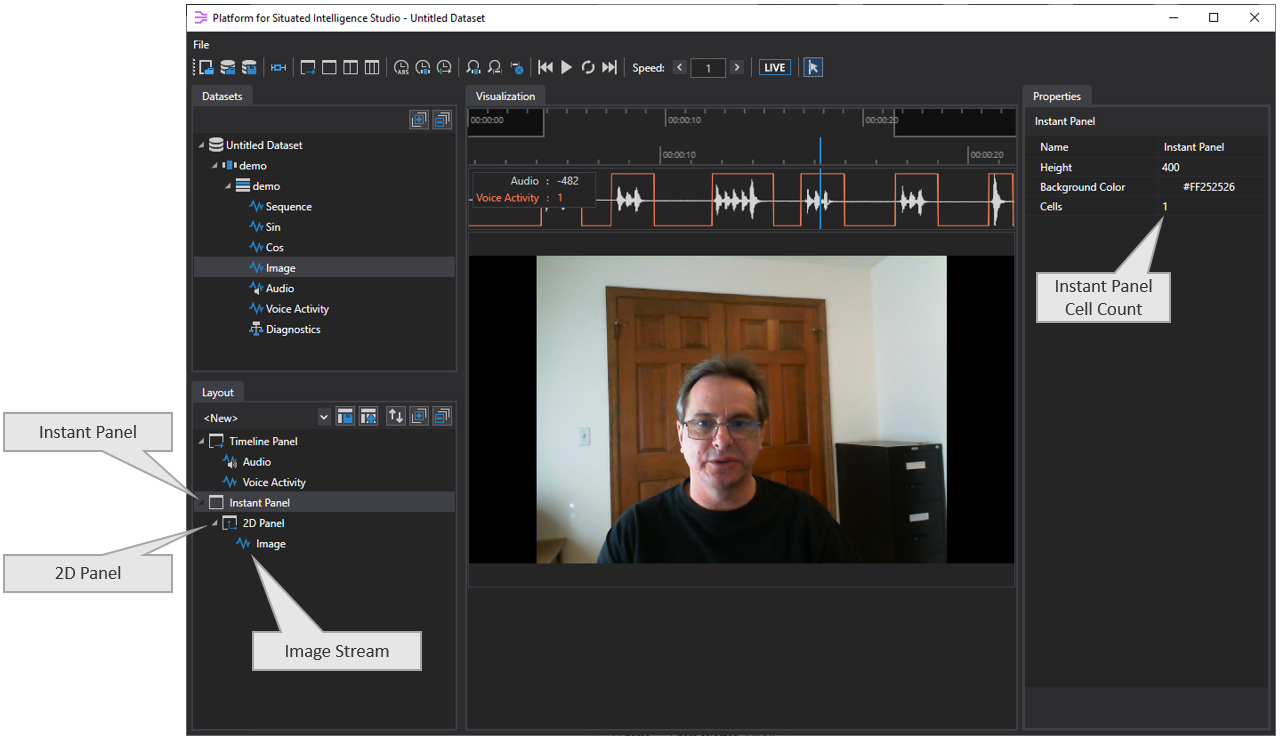
If you look at the Layout tab you will see that an instant panel was created which allows multiple instant visualization panels to be arrayed side by side, then a 2D panel was created under it, and finally the video stream was created under the 2D panel. Clicking on this instant panel will display its properties in the Properties window on the right. The Cells property is currently set to 1 but you can increase this value to have up to 5 instant visualization panels side by side. If you increase this value to 2 you will see a second instant visualization panel added to the right of the existing one. Notice in the Layout tab there are now two child panels of Instant Panel: the 2D panel containing the Image visualization panel, and a second panel named -Empty-. This empty panel placeholder will be transformed into either a 2D panel or a 3D panel when you drop your first stream into it. If you now drag the Diagnostics stream into this empty panel then PsiStudio will now look like the picture below.
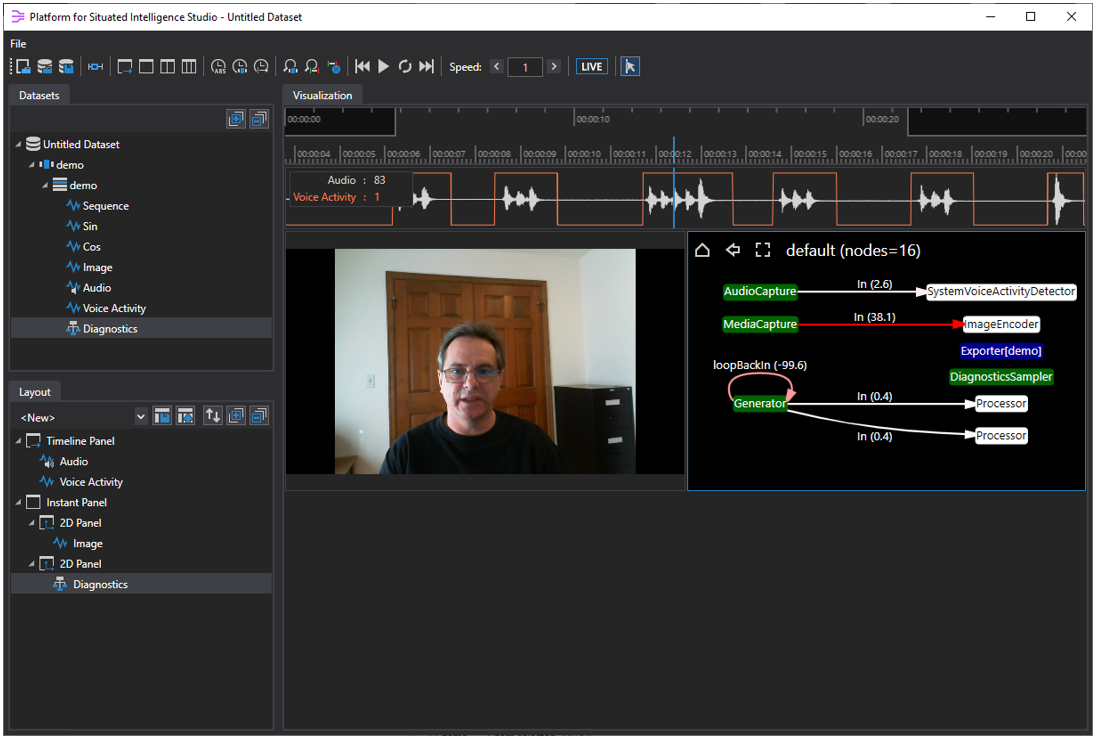
The diagnostic stream visualizer illustrates the structure of the pipeline, as well as various diagnostic statistics, and can be quite helpful for debugging your \psi application (for example, when you're trying to work out why your application runs slow or does not write the expected messages, etc); full details of how to use this stream and the visualizer to debug can be found here, but for now we'll delete this visualization by setting the cell count in the instant panel back to 1.
The image visualizer is synchronized to the timeline, as you move the cursor within any of the timeline visualization windows, the video stream shows the image that was captured at that point in time.
There are three Cursor Modes in PsiStudio, and up until now we have been using the Manual cursor mode, where the cursor follows the user's mouse pointer and will display images and data values at whatever point in time the user places his mouse. Now we'll demonstrate the second cursor mode, known as Playback Mode, and it is engaged whenever we play back our data within some time interval.
Use your mouse wheel to zoom into an interesting part of the audio timeline, and ensure that Legends are switched on (right-click on a visualization panel and select Show/Hide legend).
To do playback, we need to first select a region to play back. Selections can be created in PsiStudio with Shift+LeftClick and Shift+RightClick.
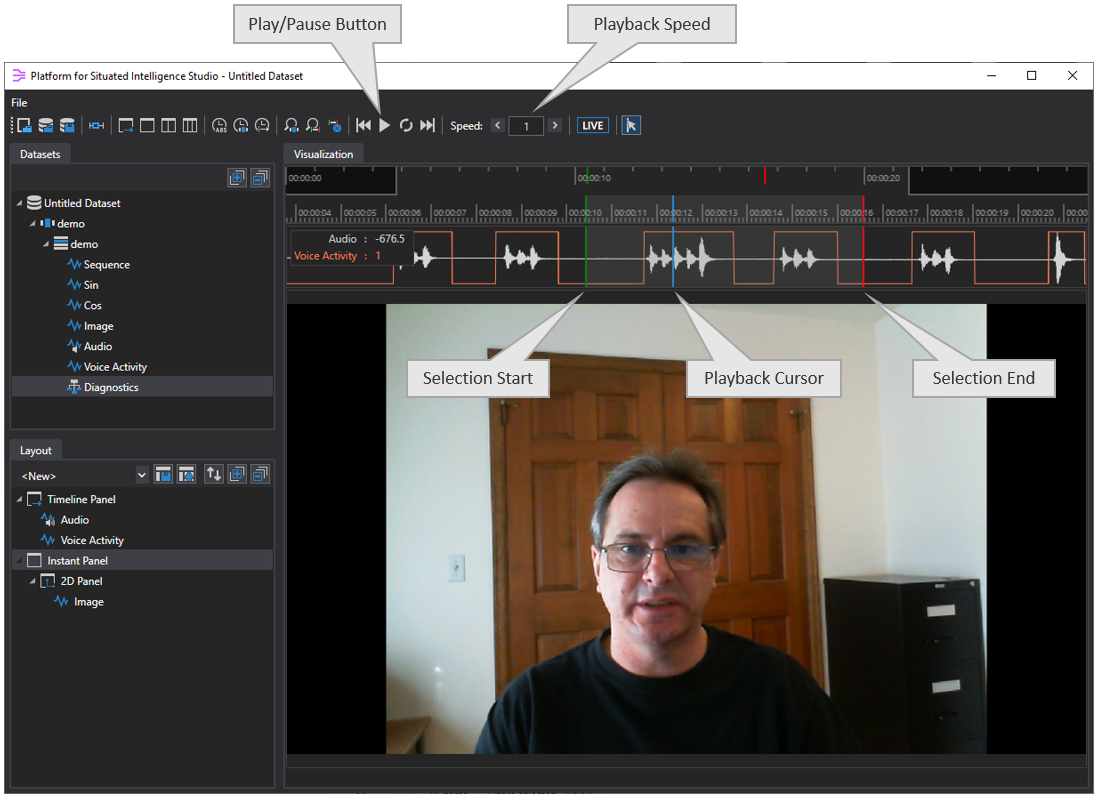
Move the mouse to a location in the timeline panel where you would like your selection to start. Now hold down the Shift key and click there. A green Selection Start marker will be placed at the mouse's position. Now move the mouse to the place where you would like your selection to end. Holding down the Shift key again, right-click there and a red Selection End marker will be placed. The selection region will be highlighted.
Now click the Play/Pause button in the toolbar and the data will be played back from the Selection Start marker to the Selection End marker. You can vary the playback speed by clicking on the Increase Playback Speed and Decrease Playback Speed buttons. The video image stream will be synchronized to the cursor's position in the audio stream, and the legend will display the data values at the cursor as the streams are played back.
By default the audio will play back through your computer's speakers as the stream plays if the playback speed is set to 1. If you wish to mute the audio, right-click on the Audio stream in the Layout tab and fromt he context menu select Mute Audio. Any number of audio streams can be played back through your speakers at once.
While so far we have discussed how to use PsiStudio to visualize previously collected data, the tool can also be used to connect to a store that is currently being written to by a running \psi application and visualizing the streams in real time.
In this example we'll be using exactly the same code we wrote in the previous section. Simply start the application running again, and let it continue to run in the background collecting data.
Since you just restarted your \psi application, it's generating a new store in a new subdirectory, and if you still have PsiStudio open from the last tutorial section you'll still be viewing the previous session. To view the new session being created, right-click on the top-level node called Untitled Dataset in the Datasets tab and from the context menu select Create Session from Store..., then in the File Open dialog go up one level to C:\recordings and then into the latest demo.#### subdirectory. Since this is a live store, you can tell that you're in the correct subdirectory because all of the files' Date modified attributes will be the current date and time. If you've opened the store of the currently running \psi application, then PsiStudio should look like this:
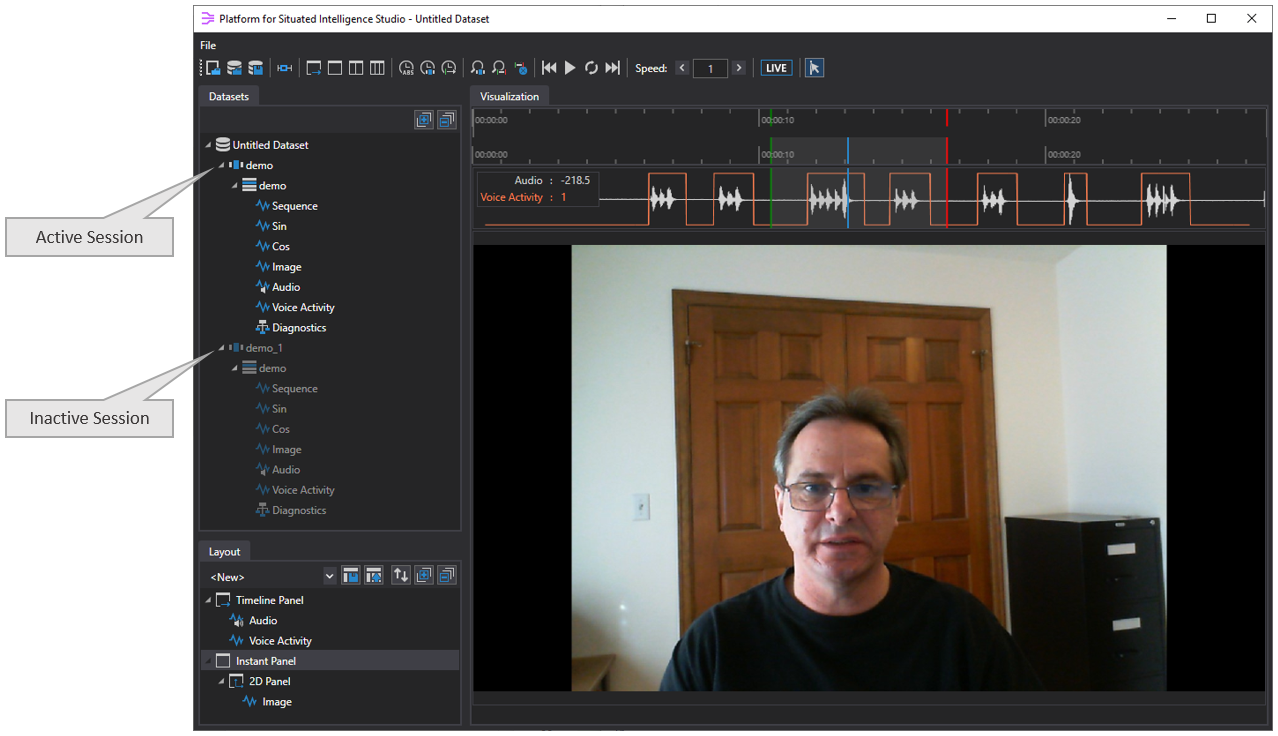
We now have a dataset with two sessions loaded, the previous session (which we can tell is the Active session being displayed in the Visualizations area because all of the tree nodes under it are lit up), and the new Inactive Live session which is currently displayed dimmed as it's not the current session being visualized. Notice that PsiStudio generated a new name for the session demo_1 to ensure that all sessions in our dataset have unique names.
PsiStudio can currently only visualize one session at a time, so to switch to visualizing the newly added session (remember this new session is live as the application is currently generating data in that store), right-click on the demo_1 session and from the context menu select Visualize Session.
After PsiStudio switched to the new session it automatically rebound all of the visualizers in the Visualizations area to the streams in the new session.
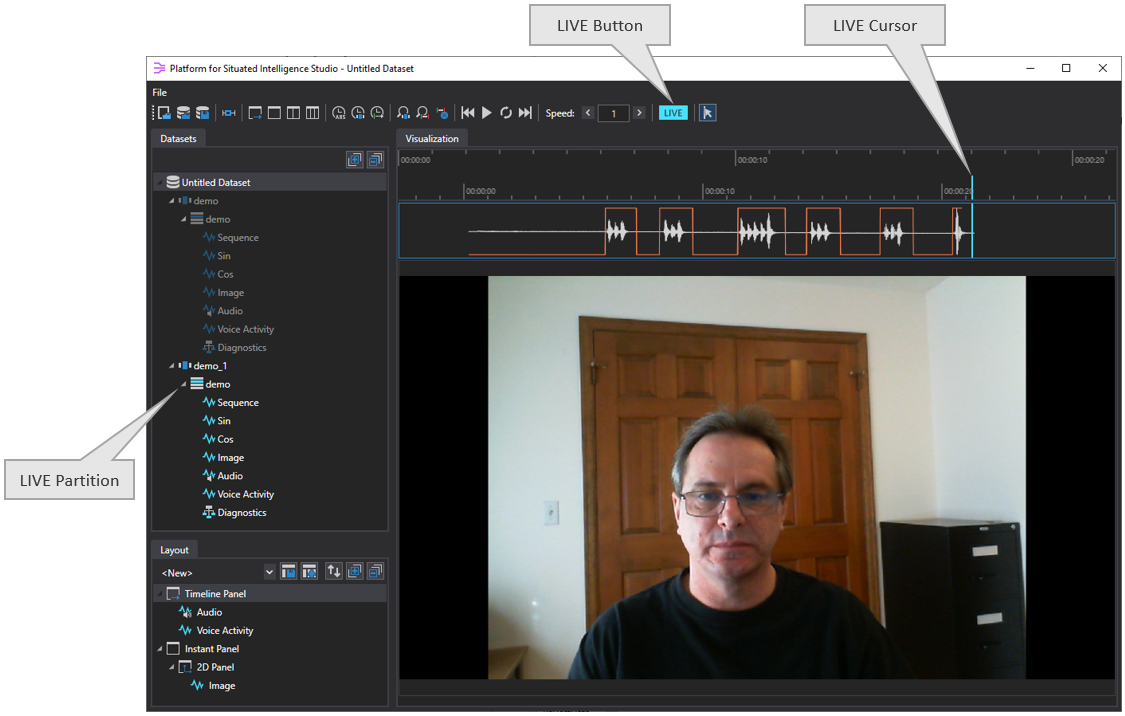
Because we've switched to visualizing a live session, PsiStudio pressed the LIVE Button on your behalf to set the cursor mode to Live. in this cursor mode, the current time cursor follows the last datapoint generated in the live store. Also notice that in this mode the timeline is automatically scrolling to keep the cursor in view and to keep up with new messages being written to the store. Notice also that the blue details of the Partition and Stream icons of a live partition are highlighted in bright blue, regular partitions and streams are rendered with a darker blue color.
PsiStudio will monitor this partition so that any new streams that the app writes will be automatically added to the Datasets tree view. PsiStudio will also detect when your \psi application stops writing to the store and will switch the cursor mode from Live mode back to Manual mode, and the Live icons next to the streams will disappear.
We have now seen the third cursor mode, called Live mode in action. When in this mode the cursor will stay in a fixed position in the visualizations window while the streaming data scrolls past. You can still use the mouse wheel to zoom in or out of the data while in Live mode. Notice that the trace for the Voice Activity Detector lags the other streams by a couple of hundred milliseconds, since that's how long it took that component to generate its messages.
Even as the application continues to run you can switch back at any time to Manual cursor mode by unclicking the LIVE button in the toolbar. When you do this, the visualization window will stop scrolling even as new data continues to be written to the store and you regain control of the cursor with the mouse. You can now drag and zoom the timeline with the mouse and position the cursor anywhere you'd like on the timeline in order to examine older messages. You can also set the Selection Start and Selection End markers and use the Play/Pause button to replay a portion of the timeline (all of this, while the application is still running and new data is being generated).
Clicking the Live button once more will switch the cursor mode back into Live mode; the cursor will catch up with the latest live messages being written to the store, and the timeline will begin automatically scrolling again as new messages are received.