Code-PS #39262
Comments
|
@dbaeumer @weinand some first baby steps (tested on macOS only):
The JSON format I am using currently is pretty much left untouched from what @weinand had before: export interface ProcessItem {
name: string;
cmd: string;
pid: string;
children?: ProcessItem[];
}I am easy on having a different format. Of course it misses the yet to be added info around CPU and memory usage. As for more info to provide, we could include the additional info we have when running "
|

|
The latest has support for Windows. |
|
and there is now a "load" attribute (atm macOS and linux only) |
|
I looked into how to get that information under Windows. Having a load percentage attribute for the whole machine is simple and I have it coded up. However having a CPU percentage value per process is quite complicated under Windows (I think under Mac / Linux as well). The reason is that you need to sample the processes over a period of time. Windows has the concept of performance counters and I found out how to query them. But there is some math involved (which I don't fully understand yet) to get to a percentage value. My approach is now that I query these counter over 10 seconds. This information will then be used to find the 5 highest CPU load processes. I will also use these counters to compute the load for all Code processes and their sub processes. @weinand how would you do this under Mac ? Regarding the format: I would prefer if the PowerShell script could include a flat structure with a parent process id and we do the inference if the tree in JS. I would also opt to only have the command line in it and do the process tagging (e.g terminal, renderer, ...) in JS code as well. Comments / Suggestions ? |
|
@dbaeumer you can find ps.ts here: https://github.com/Microsoft/vscode/blob/master/src/vs/base/node/ps.ts The easiest approach would be to just replace the command and the regexp by your command and regexp. So there is no need to produce a JSON. Just a whitespace separated table is enough. |
|
I pushed some changes:
I plan to include @egamma fingerprint for each window also to give a little bit more information about the workspace that is opened.
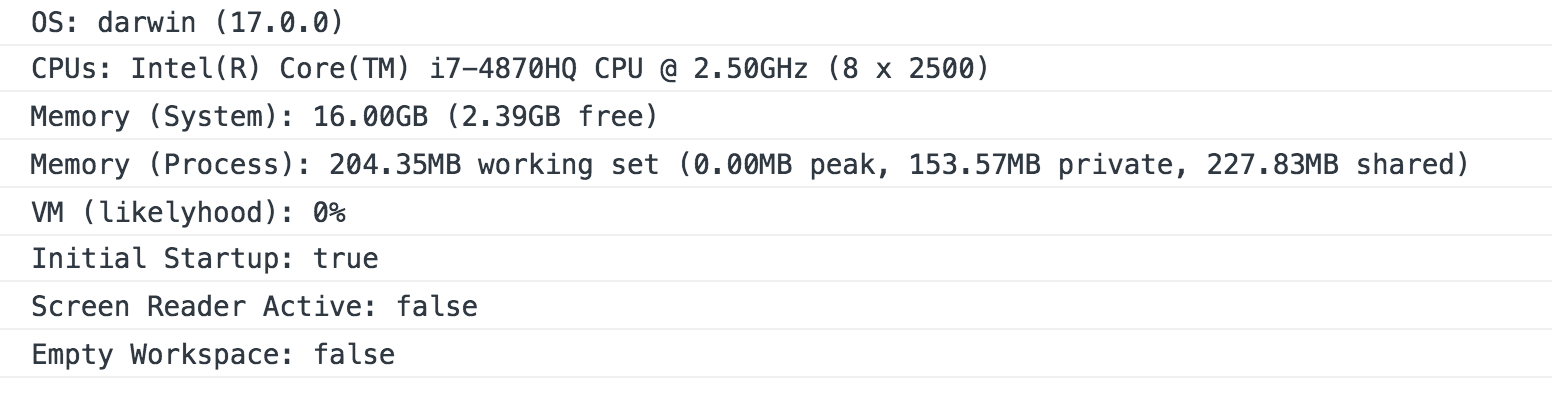
It works fine on mac and linux but still misses CPU/Memory information on Windows. The total memory information is printed via node.js methods ( |

|
I have the Windows PowerShell script running and it produces the following output: I created a flat array. I thought it is easier to extend, but I can change the format. Each top level entry has a type property, describing the info in the literal:
Both Let me know if you need more information. I can basically add whatever is necessary now that I understand how to do this in PowerShell. As said I can also change the format. Side note: I fought quite some time with hashtables in PowerShell. The key is type and if for example the key value you use is a double and the you try hashtable[4] you get nothing. You need to do hashtable[[double]4] :-). Although PowerShell doesn't really type everything needs to have a type and there is no auto conversion |
|
And this runs quickly and can be called every second without signification cpu load, correct? If yes, could you try to integrate this into ps.ts and create a PR? |
|
Here is a doc page of the process attributes available in Windows: https://msdn.microsoft.com/en-us/library/aa394372(v=vs.85).aspx |
|
I can check in the script. However running this every second might not work. The reason is that Get-Counter has a minimum sample length of 1 second. This is why the script basically does the sampling already. Why would we want to run this every second? To get the process tree. If this is what we need then I would factor that into another script since it is much easier to compute. |
|
Yes, to get a "live" tree where new processes show up immediately we currently poll. |
|
I have checked code-ps.ps1 into our git repository. It is alongside the cli.ts. |
|
Based on feedback from @egamma I renamed the startup argument to " |
|
The "vscode-processes" extension (which uses a copy of https://github.com/Microsoft/vscode/blob/master/src/vs/base/node/ps.ts) lives here: https://github.com/weinand/vscode-processes |
|
@dbaeumer are you planning to provide windows support for CPU/Memory? I think that would be the only thing left to do here. |
|
OK. Will have a look then. |
|
@bpasero qq: you pass a root PID. This will not catch any orphaned or leaking code processes. My current script takes whether we want to capture |
|
Windows output: Version: code-oss-dev 1.19.0 (Commit unknown, Date unknown) |
|
@weinand some notes:
My proposal would be to report mem usage in total byes from ps.ts and do the calculation for Linux / Mac there. |
|
And would be cool if I could return more than the root process. I am for example collecting the 5 top processes as well in terms of CPU load. Might give an indication that something is busy outside VS Code. In additional I collect orphaned code processes. So if VS Code crashes and leaves an orphaned extension host behind you will see that. |
|
Thanks. I am not sure we can track the process usage on Linux/macOS using PS but I let @weinand comment on that. I suggest we close this issue and continue in individual more fine grained issues. @dbaeumer if you want to capture your suggestions into issues, there is a |
|
@bpasero what do you mean by "process usage"? |
|
|
Aha, you meant "mem usage". I can look into this (but not for this milestone). |
|
@weinand thanks! |
Issue is used to collect ideas around a code-ps tools to collect process information about running code processes:
memory, cores, CPU and memory usage
parent process, CPU, memory, kind, ...
The text was updated successfully, but these errors were encountered: