breakpoint shown in editor is too high to see the important information #68654
Assignees

Labels
Milestone
Comments
|
I limited the height of the stack to 500px. Try it out in Thursday vscode insiders and let us know how it owkrs for you |
sandy081
pushed a commit
to vldmrkl/vscode
that referenced
this issue
Feb 22, 2019
|
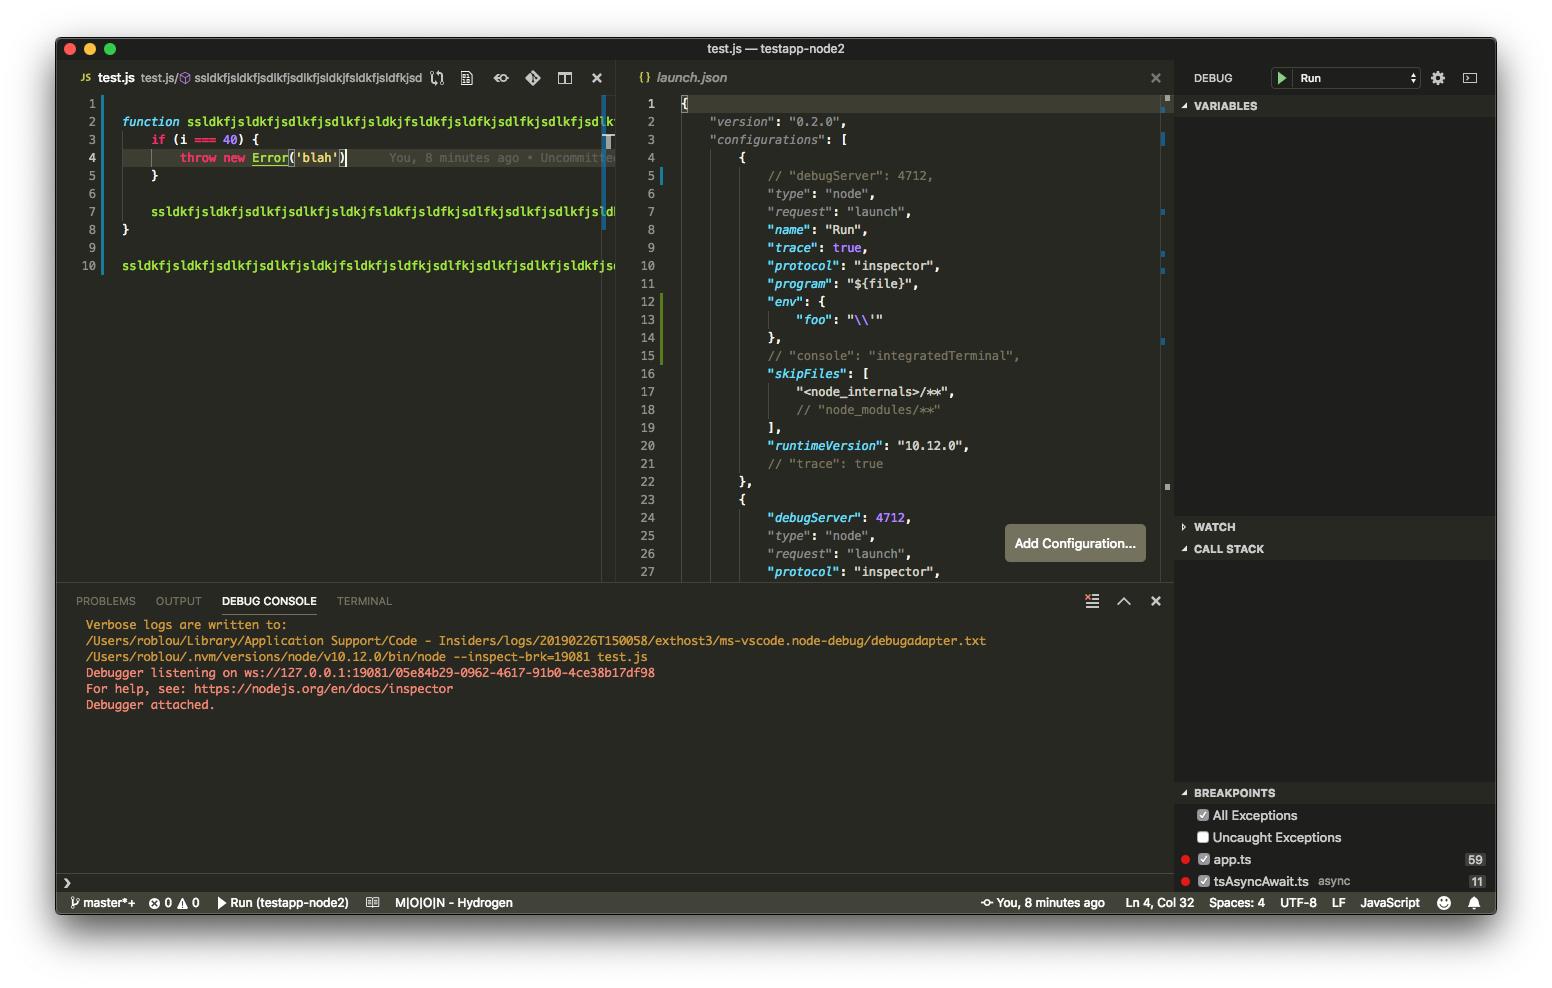
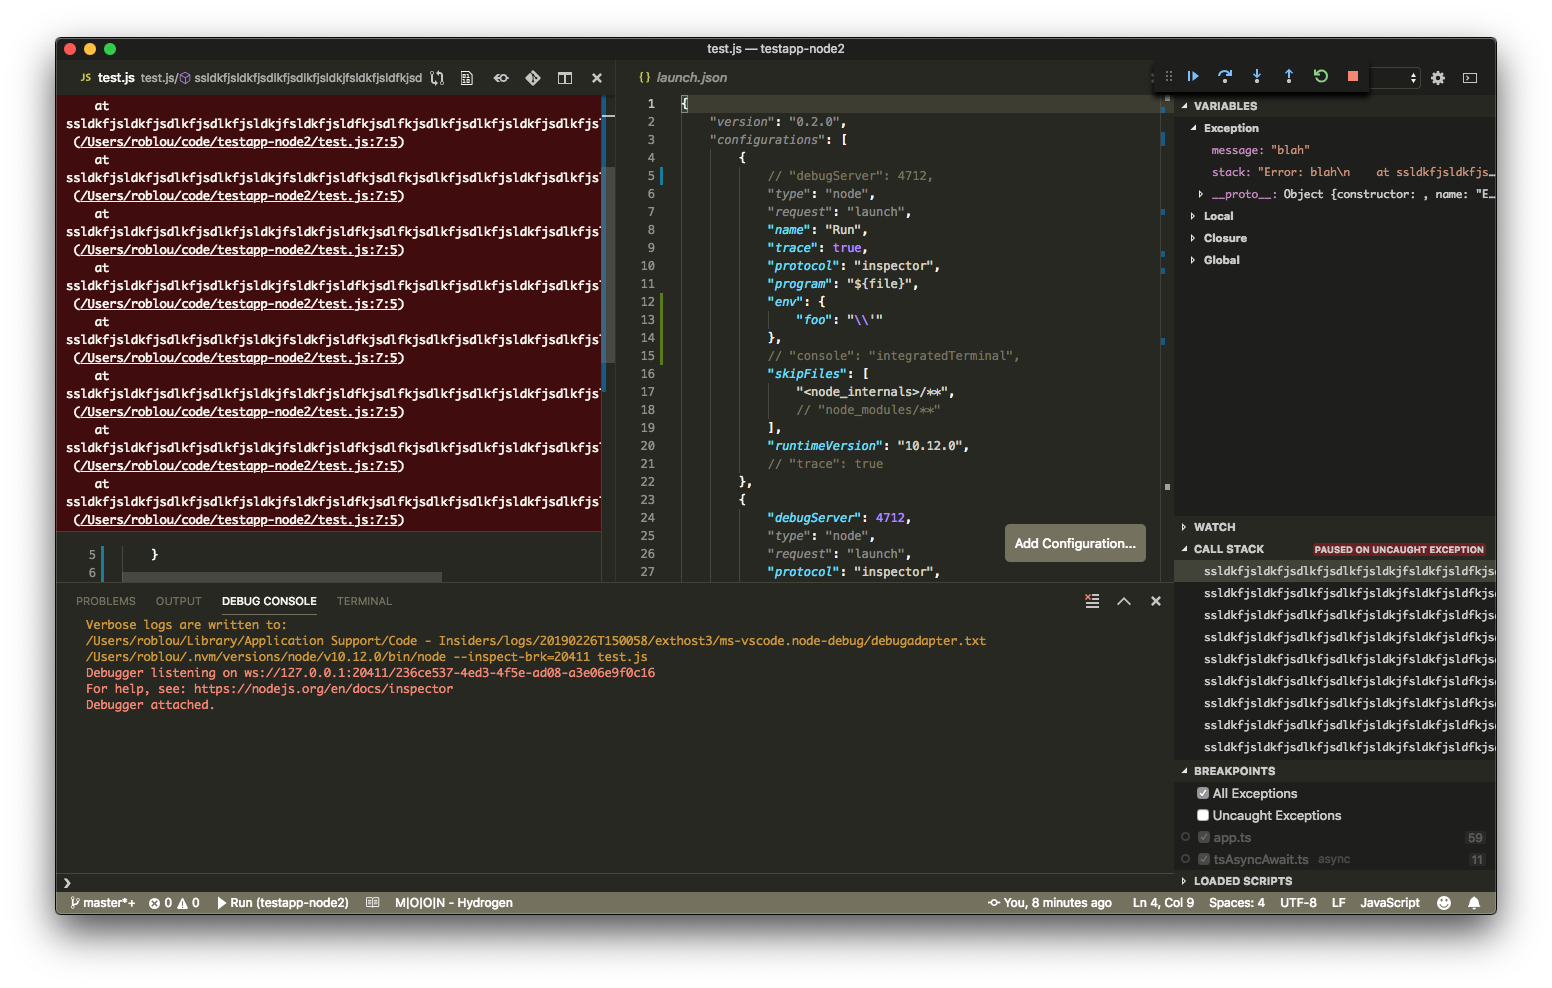
@isidorn it looks like you were already truncating the stack to 10 lines, and this prevents the widget from growing past 500px when the text wraps, is that right? This helps but it still depends on the size of the editor window. It would be better if we can reveal the top line after showing the exception widget, is that possible at all? Made up example: Decent size editor window:
Still not a good experience when breaking on exception: |
|
Good catch. Now I am revealing the editor line so the top is always shown |
Sign up for free
to subscribe to this conversation on GitHub.
Already have an account?
Sign in.
Issue Type: Bug
When you have break on all exceptions turned on, and it stops at an exception, it's nice that you can see the breakpoint info right in the editor, but frequently the call stack is so long that you see the bottom of the stack and have to scroll up several screens to see anything useful. In the example below, I had to scroll up about 6 full screens (!) to get to the code and top of the call stack. This is especially annoying when you stop at a bunch of expected exceptions from within vscode that you can't do anything about (common when debugging extensions), because you can't just F5 past them without having scrolled up first to figure out what the problem is.
Please display the top of the call stack rather than the bottom. Thanks!
VS Code version: Code - Insiders 1.32.0-insider (d18d0ed, 2019-02-11T17:46:35.980Z)
OS version: Darwin x64 18.2.0
System Info
checker_imaging: disabled_off
flash_3d: enabled
flash_stage3d: enabled
flash_stage3d_baseline: enabled
gpu_compositing: enabled
multiple_raster_threads: enabled_on
native_gpu_memory_buffers: enabled
rasterization: enabled
surface_synchronization: enabled_on
video_decode: enabled
webgl: enabled
webgl2: enabled
Extensions (5)
The text was updated successfully, but these errors were encountered: