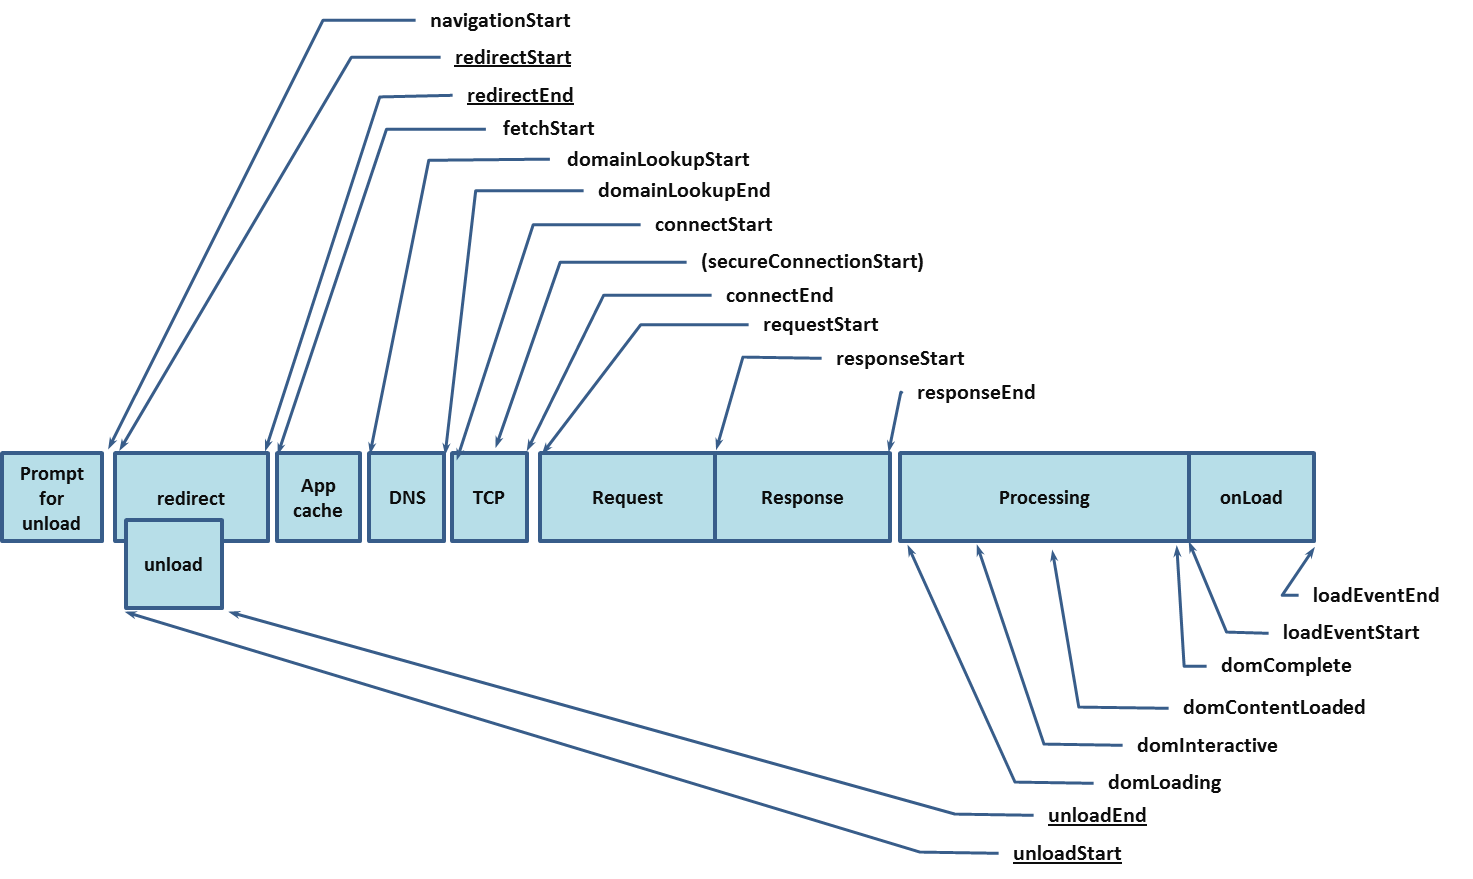
Leveraging HTML5 Navigation Timing and Resource Timing API natively build into browser. Providing high resolution time stamps and exceeding accuracy of approx. more than 70% compared to Google's 1%.
| Browser | Navigation Timing API | Resource Timing API |
|---|---|---|
| Internet Explorer | 10+ | 9+ |
| Edge | 12+ | 12+ |
| Firefox | 35+ | 7+ |
| Chrome | 25+ | 6+ |
| Safari | 11+ | 8+ |
| iOS Safari | 11+ | 9.2+ |
| Opera | 15+ | 15+ |
| Android Browser | 4.4+ | 4+ |
- HTML5 Rocks
- Wikipedia – Perceived performance
- Smashing Magazine – Why Perceived Performance Matters
- Google – Critical Rendering Path
- Steve Souders - Resource Timing practical tips
- sitepoint - Introduction to the Resource Timing API
- Patrick Sexton
- API's supported by majority of browsers
- Native / Vanilla JavaScript without any library dependency i.e. like jQuery
- No third party and their associated fees
- High precision of page load performance as GA event value
- Circumventing 1% sampling of Google Analytics
- Higher significance even on low traffic sites or when viewing a section of a website
- Real time user waited since requesting a page (check out )
- Wealth of information about each network hop
Why not using Google Analytics build in Site Speed Analysis?
- Significance issue: Speed metrics of a mere 1% of your users are collected
- Details: Important details where delays may triggered missing (Server, network or client side delays)
Note: Sampling rate can be increased but still remains with up to ten percent way below what's actually possible! To increase sampling rate check the GA-Documentation.
Note: there are two events generated, "Page Load Time" and "Load Time Total Resource", which are explained as follows.
Load speed information of the viewed page
- Type of navigation ⋅⋅* 0 Navigate ⋅⋅* 1 Reload ⋅⋅* 2 History change ⋅⋅* 255 Undefined
- Initial (App Cache used, performance.timing.domainLookupStart equals performance.timing.fetchStart)
- Count of redirects (if any)
- Mark SSL connection (if SSL used in page protocol)
- Count of resources
- Count of XHR's (if any, bound to hashChange)
Regular navigation with leveraging browser cache: 0 Navigate
Regular navigation with leveraging browser cache and one redirect: 0 Navigate 1
Regular navigation with leveraging browser cache with SSL: 0 Navigate 1 SSL
Regular navigation with leveraging browser cache, one redirect, SSL and one XHR: 0 Navigate 1 SSL XHR 1
Note: This represents raw data, all details collected in an array! It's purpose is to analyze all details by doing sophisticated data mining i.e. with KNIME Analytics Platform.
- Total amount of loaded resources
- Count of resource type (img, css, js, font, doc, fallback)
- Count of DOM-Nodes (indicating complex documents limiting UX with high rendering times)
- Required time for each timing event since navigation start
0,0,0,0,0,0,0 - 1788 - 0|0|0.053|0.004|0.036|0|2.033|2.199|0.33|0.887|0|3.25|0.554|-1507571697.364|0|-1507571696.81|6.512 Explanation
- "0,0,0,0,0,0,0" No support of resource API
- "1788" DOM Nodes
- "0|0|0.053|0.004|0.036|0|2.033|2.199|0.33|0.887|0|3.25|0.554|-1507571697.364|0|-1507571696.81|6.512" whole array of timing events with milestones "Network Latency", "DOM & CSSDOM parsed" and "Page completed" as well as total load time since navigation start
Note: Strong negatives like "-1507571697.364" show that the end event (i.e. performance.timing.domComplete - performance.timing.domContentLoadedEventEnd) did not finished upon script execution indicating "blocking" resources
Resource load speed information of the viewed page. No insights won't be gained without data mining here … except based on the avg. event value in combination with GA Content Grouping.
Omitting event action as it simply "Resource details"
A joined string of a multi-dimensional array to count resources and sum their load time based on:
- Domain
- Initiator
- Resource type (extension)
Note: I won't go into details as I created this for the sake of completeness. In Google Analytics, when properly done, you can link the "Page Load Time" with the "Load Time Total Resource" event to check if a resource of the origin or foreign domain caused the delay. Or, on a higher level, analyze the resources of a certain page or type of page (i.e. category, product or checkout).
Example label: ,,,,,,,,,,1,1402,1,87,,,,,,,,,,,,,,,1,193,,,,,,,,,,,,,,,,,,,,,,,,,,,,,,,,,,,,,,,,,,|,,,,,,,,,,,,,,,,,,,,,,,,,,,,,,,,,,,,,,,,,,,,,,,,,,,,,,,,,,,,,,,,,,,,,,,|,,,,,,,,,,,,,,,,,,,,,,,,,,,,,,,,,,,,,,,,,,,,,,,,,,,,,,,,,,,,,,1,309,,,,,,,,
None, except you want to use a tagging system like Google Tag Manager
A lot but to keep it simple:
- Created an event listener for hashChange
- Collect information from Navigation Timing API and Resource Timing API
- Calculates performance metric timings
- Calculates resources timings
- Constructs the GA-Event
- Pushes the data into the data layer of Google tag Manager
- Download the script
- Embed it in the website or in the Tag Manager of choice
- Create a loading trigger. I recommend window.onload as all sub-resources should have finished loading
0.2 Current Release
- Added readme
- Added MIT license
- Cleaned tracking script
0.1 Initialization
- Adding the Knime workflow in a separate repo
- Elaborate to gain more insights from the resource event like cache misses, resource redirects, mixed protocols or "broken" resources responding with 404 or even 5xx
- Send a separate event for resources identified being a blocker during this load with detailed information about it's resource timings

Mike Wiegand - atMedia Online Marketing
See also the list of Acknowledgments where their work greatly contributed to this project.
This project is licensed under the MIT License - see the LICENSE.md file for details
- Steve Field for the function to dynamically attach the hashChange event lister
- Matthew Crumley for dynamically / efficiently creating a multi-dimensional array