TechDocs Intel
 https://raw.githubusercontent.com/wiki/mikesart/gpuvis/images/gpuvis_intel.jpg
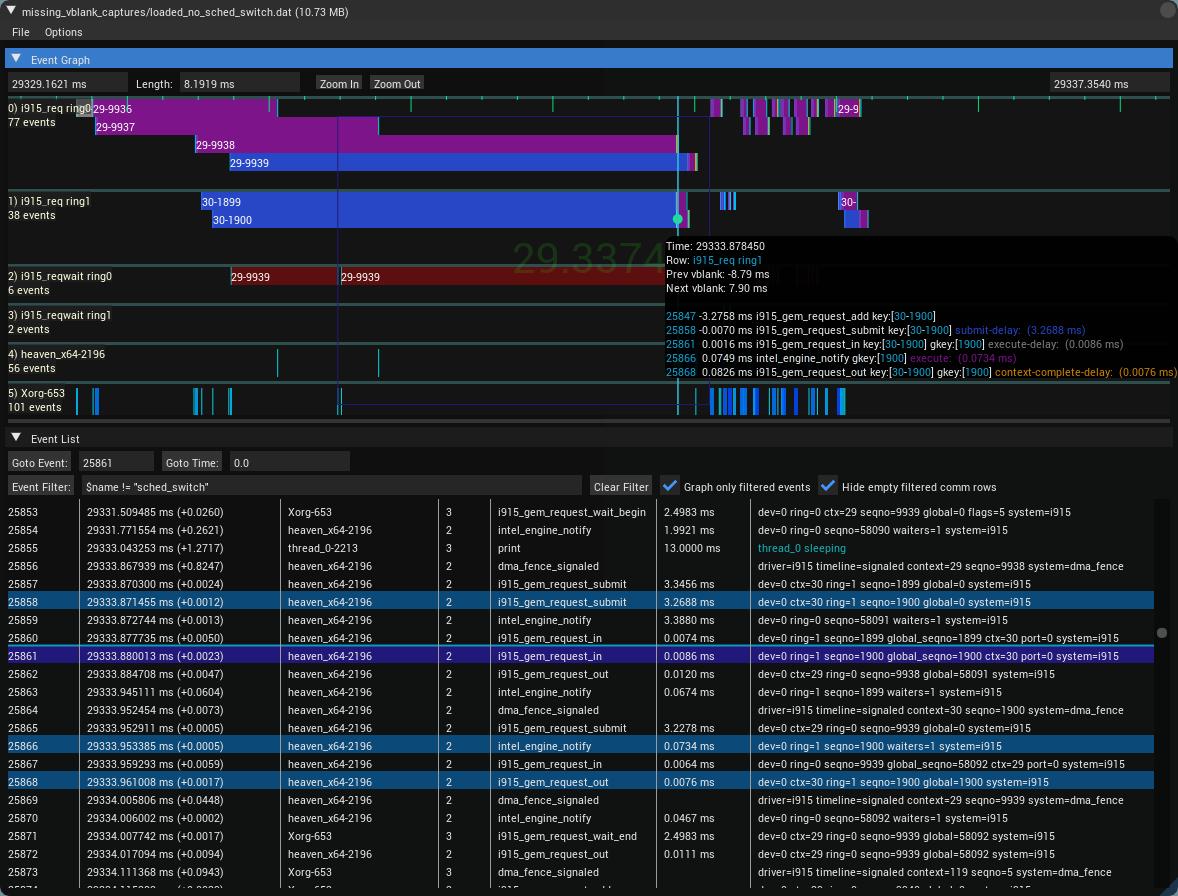
https://lists.freedesktop.org/archives/intel-gfx/2017-September/137622.html
On Wed, Sep 6, 2017, at 03:09 AM, Chris Wilson wrote:
> We already have those tracepoint equivs [to amdgpu] and a script to generate a
> similar visualisation: intel-gpu-tools/scripts/trace.pl, but only
> looking at the scheduling issue from the gpu pov. But it's really only a
> dev toy atm, plugging the gap between userspace and the gpu has been on
> the perennial wishlist.
- https://cgit.freedesktop.org/xorg/app/intel-gpu-tools/tree/scripts/trace.pl
- https://lists.freedesktop.org/archives/intel-gfx/2017-January/118190.html
- https://people.freedesktop.org/~tursulin/trace-demo.html
- i915_flip_request
"plane=%d, obj=%p" - i915_flip_complete
"plane=%d, obj=%p" - intel_gpu_freq_change
"new_freq=%u" - i915_gem_request_add
"dev=%u, ring=%u, ctx=%u, seqno=%u, global=%u" -
i915_gem_request_submit
"dev=%u, ring=%u, ctx=%u, seqno=%u, global=%u" -
i915_gem_request_in
"dev=%u, ring=%u, ctx=%u, seqno=%u, global=%u, port=%u" -
i915_gem_request_out
"dev=%u, ring=%u, ctx=%u, seqno=%u, global=%u, port=%u" - intel_engine_notify
"dev=%u, ring=%u, seqno=$u, waiters=%u" - i915_gem_request_wait_begin
"dev=%u, ring=%u, ctx=%u, seqno=%u, global=%u, blocking=%u, flags=0x%x" - i915_gem_request_wait_end
"ring=%u, ctx=%u, seqno=%u, global=%u"
Bold events require the CONFIG_DRM_I915_LOW_LEVEL_TRACEPOINTS Kconfig option to be enabled.
i915_gem_request_wait_begin:
  key = db_key( ring, ctx, seqno )
  if !(key in reqwait)
    reqwait[ key ].start = s

parse i915_gem_request_wait_end
  key = db_key( ring, ctx, seqno )
  if ( key in reqwait )
    reqwait[ key ].end = s
 https://raw.githubusercontent.com/wiki/mikesart/gpuvis/images/i915_diagram.jpg
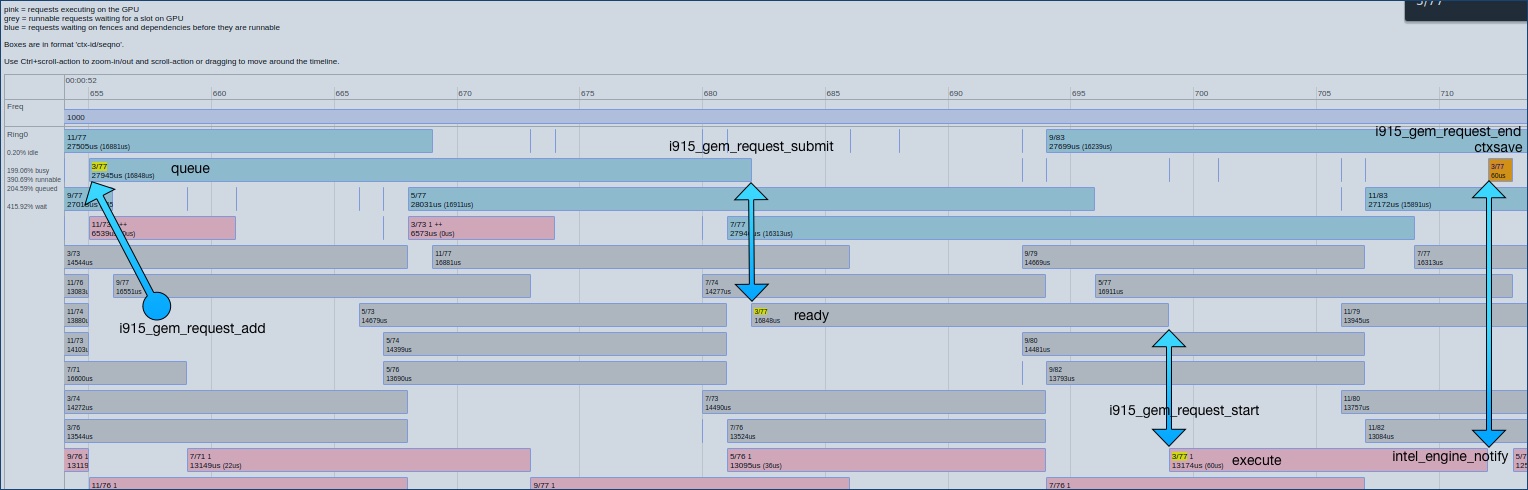
-
queue: Submit to execute. Requests waiting on fences and dependencies before they are runnable.
db[ key ].submit-delay = submit[ key ] - queue[ key ] -
ready: Execute to start. Runnable requests waiting for a slot on GPU.
req[ key ].execute-delay = req[ start ] - submit[ key ] -
execute: Start to user interrupt. Requests executing on the GPU.
db[ key ].duration = db[ key ].notify - db[ key ].start -
ctxsave: User interrupt to context complete.
db[key].context-complete-delay = db[key].end - db[key].notify
i915_gem_request_add:
  key = db_key( ring, ctx, seqno )
  queue[ key ] = s

i915_gem_request_submit:
  key = db_key( ring, ctx, seqno )
  // submit[ key ] must not exist
  // queue[ key ] must exist
  submit[ key ] = s

i915_gem_request_in:
  key = db_key( ring, ctx, seqno )
  // db[ key ] must not exist
  // queue[ key ] must exist
  // submit[ key ] must exist
  req[ start ] = s
  req[ name ] = "ctx / seqno"
  req[ submit-delay ] = submit[ key ] - queue[ key ]
  req[ execute-delay ] = req[ start ] - submit[ key ]
  db[ key ] = req

i915_gem_request_out:
  gkey = global_key( ring, global_seqno )
  key = db_key( ring, ctx, seqno )

  // db[ key ] must exist
  // db[ key ].start must exist
  // db[ key ].end must not exist
  db[ key ].end = s

  if gkey in notify
    db[ key ].notify = notify[ gkey ]
  else
    // No notify so far. Maybe it will arrive later which
    // will be handled in the sanitation loop.
    db[ key ].notify = db[ key ].end
    db[ key ].no-notify = 1

  db[ key ].duration = db[ key ].notify - db[ key ].start
  db[ key ].context-complete-delay = db[ key ].end - db[ key ].notify

intel_engine_notify:
  gkey = global_key( ring, seqno )
  notify[ gkey ] = s
Intel hardware has the ability to record performance data generated by the GPU.
Some of this data can be captured along ftrace and displayed in Gpuvis.
Prerequisite:
You'll need to install tools from IGT.
Once the IGT tools installed, you'll need to configure Gpuvis to use them.
You can do so by giving the -DUSE_I915_PERF=ON option to cmake.
Pick a metric set:
It is possible to capture lots of different counters. Not all can be captured at the same time. You will have to select a metric set to record with.
You can list the available metric sets using : i915-perf-recorder -m list
On most Intel systems you should find a list roughly similar :
$ i915-perf-recorder -m list
Device name=kabylake gen=256 gt=2 id=0x5916
RenderBasic:               Render Metrics Basic Gen9
ComputeBasic:              Compute Metrics Basic Gen9
RenderPipeProfile:         Render Metrics for 3D Pipeline Profile Gen9
MemoryReads:               Memory Reads Distribution Gen9
MemoryWrites:              Memory Writes Distribution Gen9
ComputeExtended:           Compute Metrics Extended Gen9
ComputeL3Cache:            Compute Metrics L3 Cache Gen9
HDCAndSF:                  Metric set HDCAndSF
L3_1:                      Metric set L3_1
L3_2:                      Metric set L3_2
L3_3:                      Metric set L3_3
RasterizerAndPixelBackend: Metric set RasterizerAndPixelBackend
Sampler:                   Metric set Sampler
TDL_1:                     Metric set TDL_1
TDL_2:                     Metric set TDL_2
ComputeExtra:              Compute Metrics Extra Gen9
VMEPipe:                   Media Vme Pipe Gen9
GpuBusyness:               Gpu Rings Busyness
TestOa:                    MDAPI testing set Gen9.5
PMA_Stall:                 Metric set PMA Stall
You can list the counters in a metric set using : i915-perf-recorder -m RenderBasic -C
Here is an example of counters available for the RenderBasic metric set :
$ i915-perf-recorder -m RenderBasic -C
Device name=kabylake gen=256 gt=2 id=0x5916
RenderBasic (Render Metrics Basic Gen9):
  AVG GPU Core Frequency:        Average GPU Core Frequency in the measurement.
  CS Threads Dispatched:         The total number of compute shader hardware threads dispatched.
  DS Threads Dispatched:         The total number of domain shader hardware threads dispatched.
  Early Depth Test Fails:        The total number of pixels dropped on early depth test.
  EU Active:                     The percentage of time in which the Execution Units were actively processing.
  EU Both FPU Pipes Active:      The percentage of time in which both EU FPU pipelines were actively processing.
  EU Stall:                      The percentage of time in which the Execution Units were stalled.
  GPU Busy:                      The percentage of time in which the GPU has been processing GPU commands.
  GPU Core Clocks:               The total number of GPU core clocks elapsed during the measurement.
  GPU Time Elapsed:              Time elapsed on the GPU during the measurement.
  GS Threads Dispatched:         The total number of geometry shader hardware threads dispatched.
  GTI Depth Throughput:          The total number of GPU memory bytes transferred between depth caches and GTI.
  GTI HDC TLB Lookup Throughput: The total number of GPU memory bytes transferred between GTI and HDC, when HDC is doing TLB lookups.
  GTI L3 Throughput:             The total number of GPU memory bytes transferred between L3 caches and GTI.
  GTI RCC Throughput:            The total number of GPU memory bytes transferred between render color caches and GTI.
  GTI Read Throughput:           The total number of GPU memory bytes read from GTI.
  GTI Fixed Pipe Throughput:     The total number of GPU memory bytes transferred between 3D Pipeline (Command Dispatch, Input Assembly and Stream Output) and GTI.
  GTI Write Throughput:          The total number of GPU memory bytes written to GTI.
  Early Hi-Depth Test Fails:     The total number of pixels dropped on early hierarchical depth test.
  HS Threads Dispatched:         The total number of hull shader hardware threads dispatched.
  L3 Lookup Accesses w/o IC:     The total number of L3 cache lookup accesses w/o IC.
  L3 Misses:                     The total number of L3 misses.
  L3 Sampler Throughput:         The total number of GPU memory bytes transferred between samplers and L3 caches.
  L3 Shader Throughput:          The total number of GPU memory bytes transferred between shaders and L3 caches w/o URB.
  Pixels Failing Tests:          The total number of pixels dropped on post-FS alpha, stencil, or depth tests.
  FS Both FPU Active:            The percentage of time in which fragment shaders were processed actively on the both FPUs.
  PS FPU0 Pipe Active:           The percentage of time in which EU FPU0 pipeline was actively processing a pixel shader instruction.
  PS FPU1 Pipe Active:           The percentage of time in which EU FPU1 pipeline was actively processing a pixel shader instruction.
  PS Send Pipeline Active:       The percentage of time in which EU send pipeline was actively processing a pixel shader instruction.
  FS Threads Dispatched:         The total number of fragment shader hardware threads dispatched.
  Rasterized Pixels:             The total number of rasterized pixels.
  Sampler 0 Bottleneck:          The percentage of time in which Sampler 0 has been slowing down the pipe when processing EU requests.
  Sampler 0 Busy:                The percentage of time in which Sampler 0 has been processing EU requests.
  Sampler 1 Bottleneck:          The percentage of time in which Sampler 1 has been slowing down the pipe when processing EU requests.
  Sampler 1 Busy:                The percentage of time in which Sampler 1 has been processing EU requests.
  Samplers Bottleneck:           The percentage of time in which samplers have been slowing down the pipe when processing EU requests.
  Sampler Cache Misses:          The total number of sampler cache misses in all LODs in all sampler units.
  Sampler Texels Misses:         The total number of texels lookups (with 2x2 accuracy) that missed L1 sampler cache.
  Sampler Texels:                The total number of texels seen on input (with 2x2 accuracy) in all sampler units.
  Samplers Busy:                 The percentage of time in which samplers have been processing EU requests.
  Samples Blended:               The total number of blended samples or pixels written to all render targets.
  Samples Killed in FS:          The total number of samples or pixels dropped in fragment shaders.
  Samples Written:               The total number of samples or pixels written to all render targets.
  Shader Atomic Memory Accesses: The total number of shader atomic memory accesses.
  Shader Barrier Messages:       The total number of shader barrier messages.
  Shader Memory Accesses:        The total number of shader memory accesses to L3.
  SLM Bytes Read:                The total number of GPU memory bytes read from shared local memory.
  SLM Bytes Written:             The total number of GPU memory bytes written into shared local memory.
  VS FPU0 Pipe Active:           The percentage of time in which EU FPU0 pipeline was actively processing a vertex shader instruction.
  VS FPU1 Pipe Active:           The percentage of time in which EU FPU1 pipeline was actively processing a vertex shader instruction.
  VS Send Pipe Active:           The percentage of time in which EU send pipeline was actively processing a vertex shader instruction.
  VS Threads Dispatched:         The total number of vertex shader hardware threads dispatched.
The steps are pretty similar to the normal capture ones :
export USE_I915_PERF=1-
export I915_PERF_METRIC=RenderBasic(or any metric set name reported byi915-perf-recorder -m list) - Run
trace-cmd-setup.sh - Run
trace-cmd-start-tracing.sh - Launch app
- When interesting thing happens, run
trace-cmd-capture.sh - Goto step 6 (until you run out of interesting events)
- Stop tracing with
trace-cmd-stop-tracing.sh - Launch gpuvis on capture .dat and .i915-dat trace files
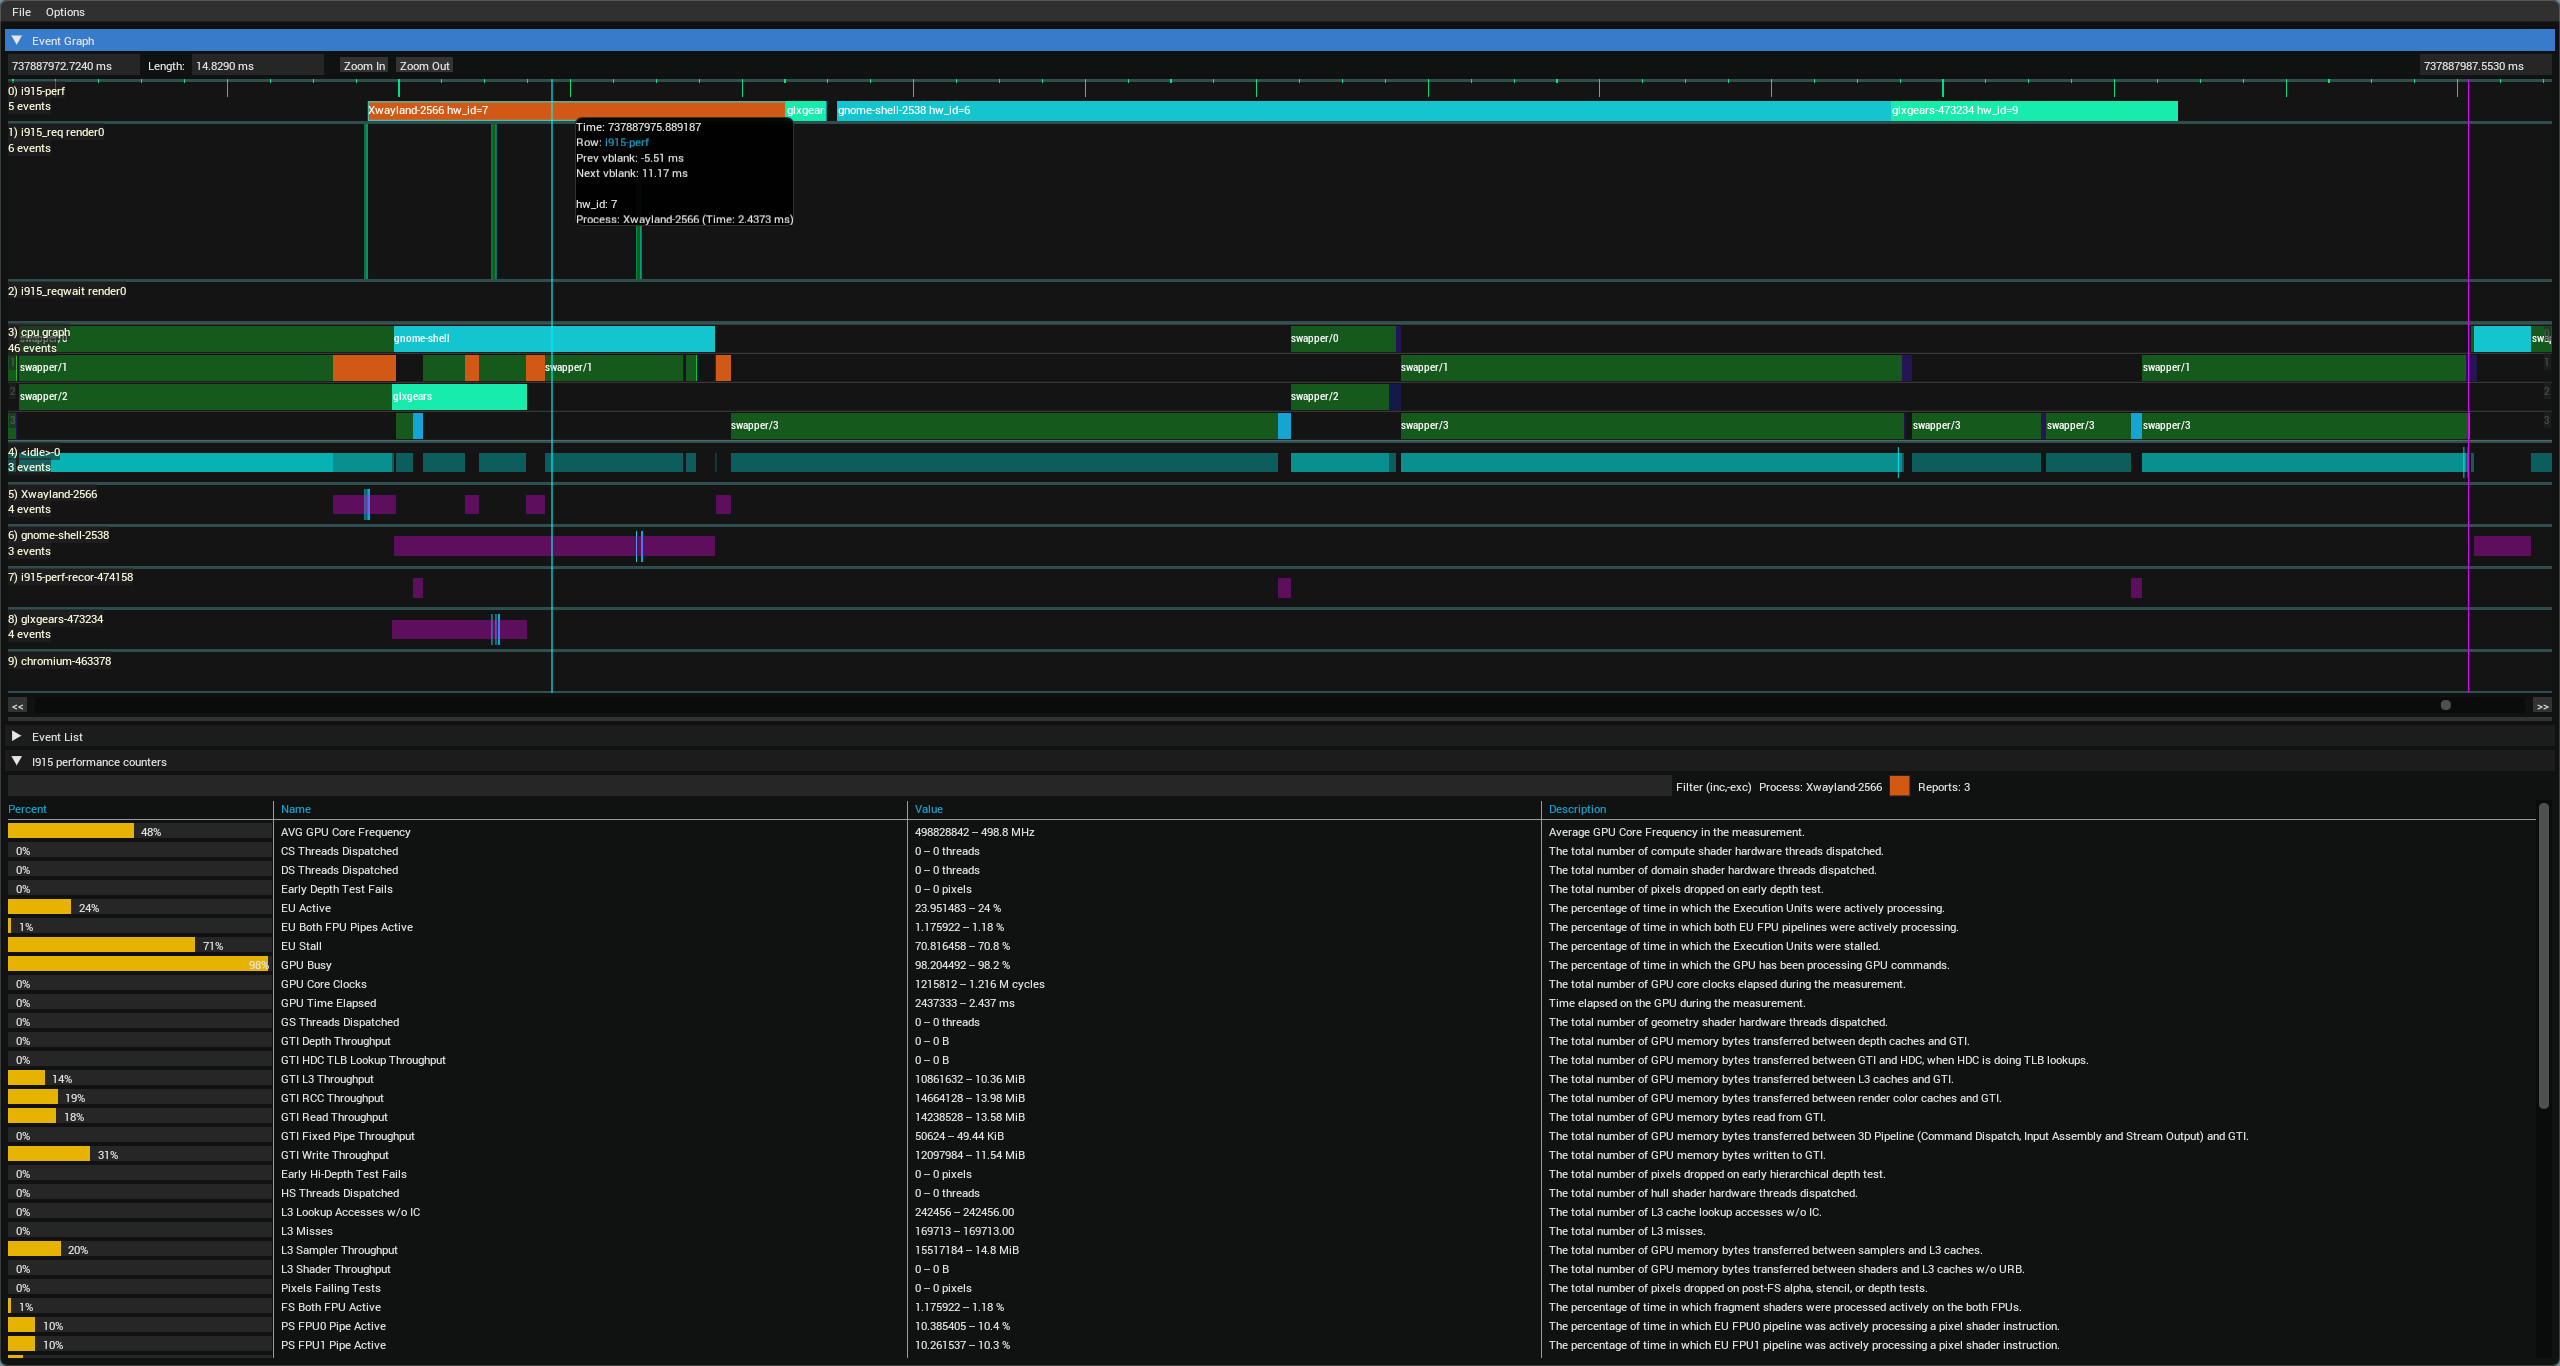
Here a preview of the additional UI bits added by the .i915-dat file, adding :
- A new row in the timeline (top row i915-perf)
- A new panel at the bottom showing performance counter values for the last timeline item hovered on the i915-perf row
 https://raw.githubusercontent.com/wiki/mikesart/gpuvis/images/gpuvis_intel_perf.jpg