Skip to content

In this tutorial, I'll show you how to use the pRecipe to download the MSWEP data, compute the average precipitation for any location and time period of your interest and use ggplot2 and rayshader to create beautiful 2D and 3D maps that show the variation of precipitation across space

milos-agathon/precipitation-maps

Repository files navigation

Precipitation maps with ggplot2 and rayshader in R

In this tutorial, I'll show you how to use the pRecipe to download the MSWEP data, compute the average precipitation for any location and time period of your interest and use ggplot2 and rayshader to create beautiful 2D and 3D maps that show the variation of precipitation across space.

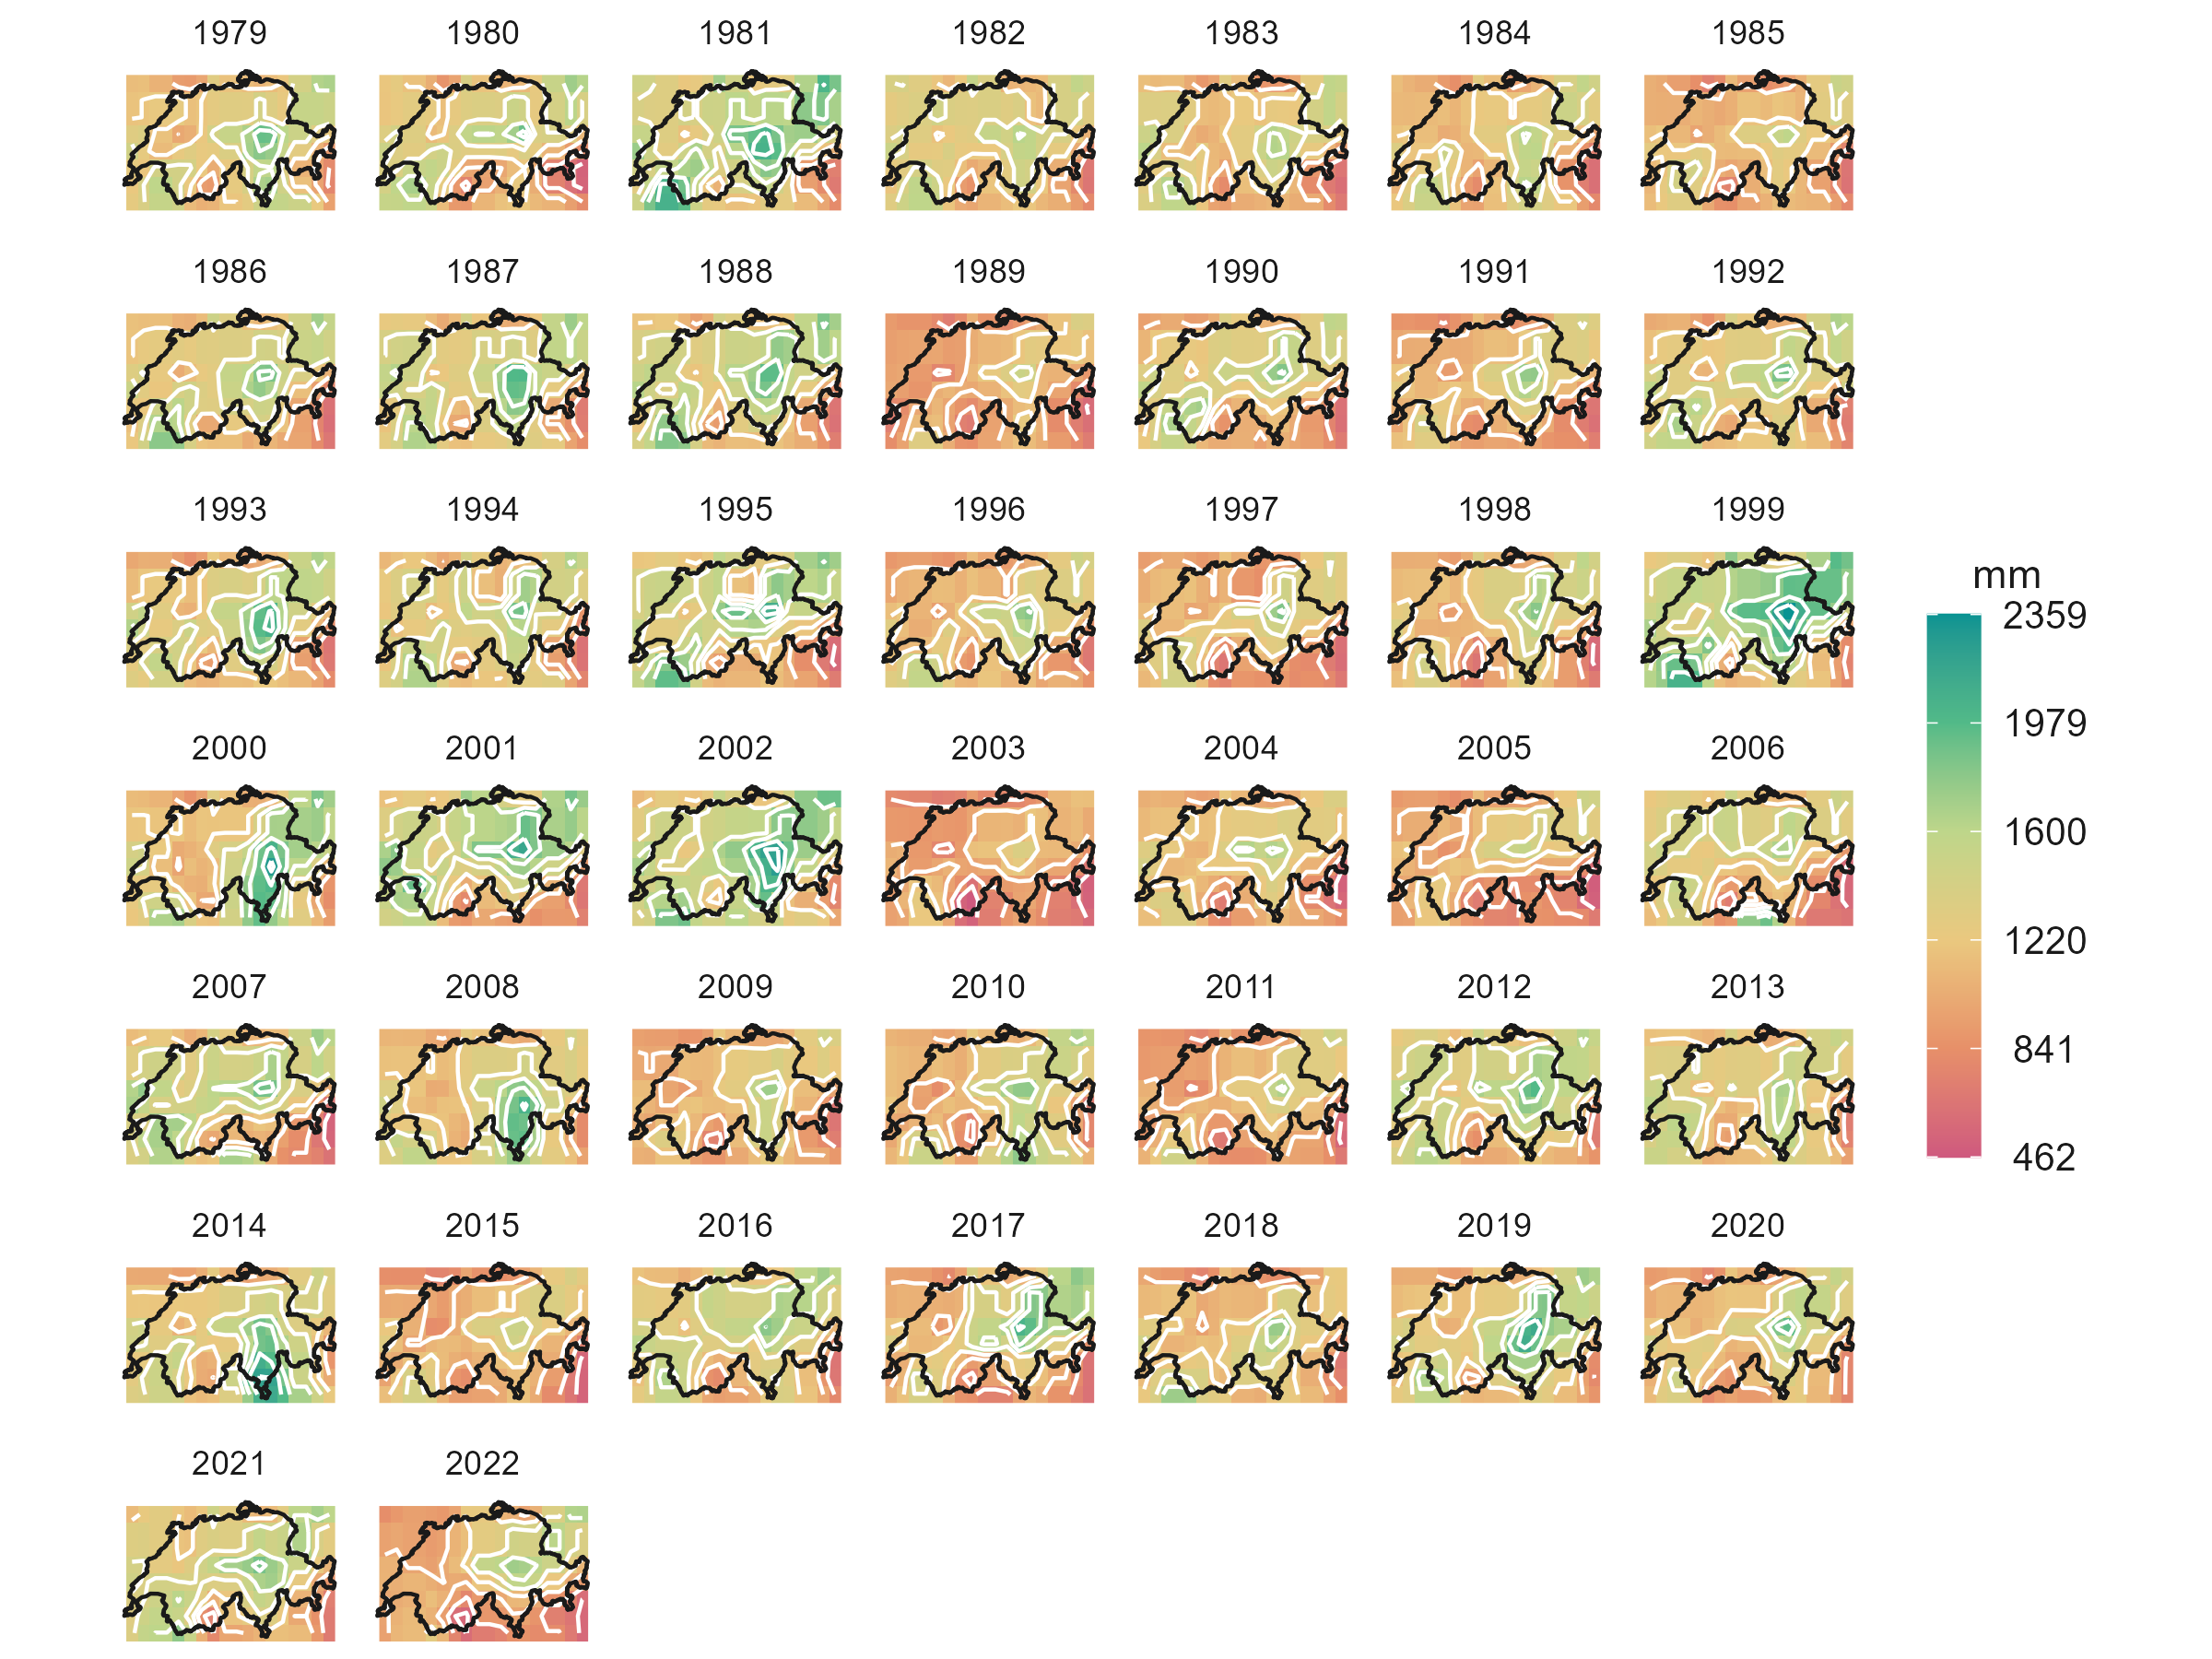
Panel map with ggplot2

alt text

2D average precipitation map with ggplot2

alt text

3D precipitation map with ggplot2 and rayshader

alt text

About

In this tutorial, I'll show you how to use the pRecipe to download the MSWEP data, compute the average precipitation for any location and time period of your interest and use ggplot2 and rayshader to create beautiful 2D and 3D maps that show the variation of precipitation across space

Resources

Stars

Watchers

Forks

Releases

No releases published

Packages

No packages published

Languages