Graphite, Sensu and Logstash monitoring stack. Virtual states that installs them all.
monitoring:enabled (default True)
Used to configure whether monitoring should be enabled/installed at all. It's useful as client side of monitoring is an implicit dependency. This works on both client and server states
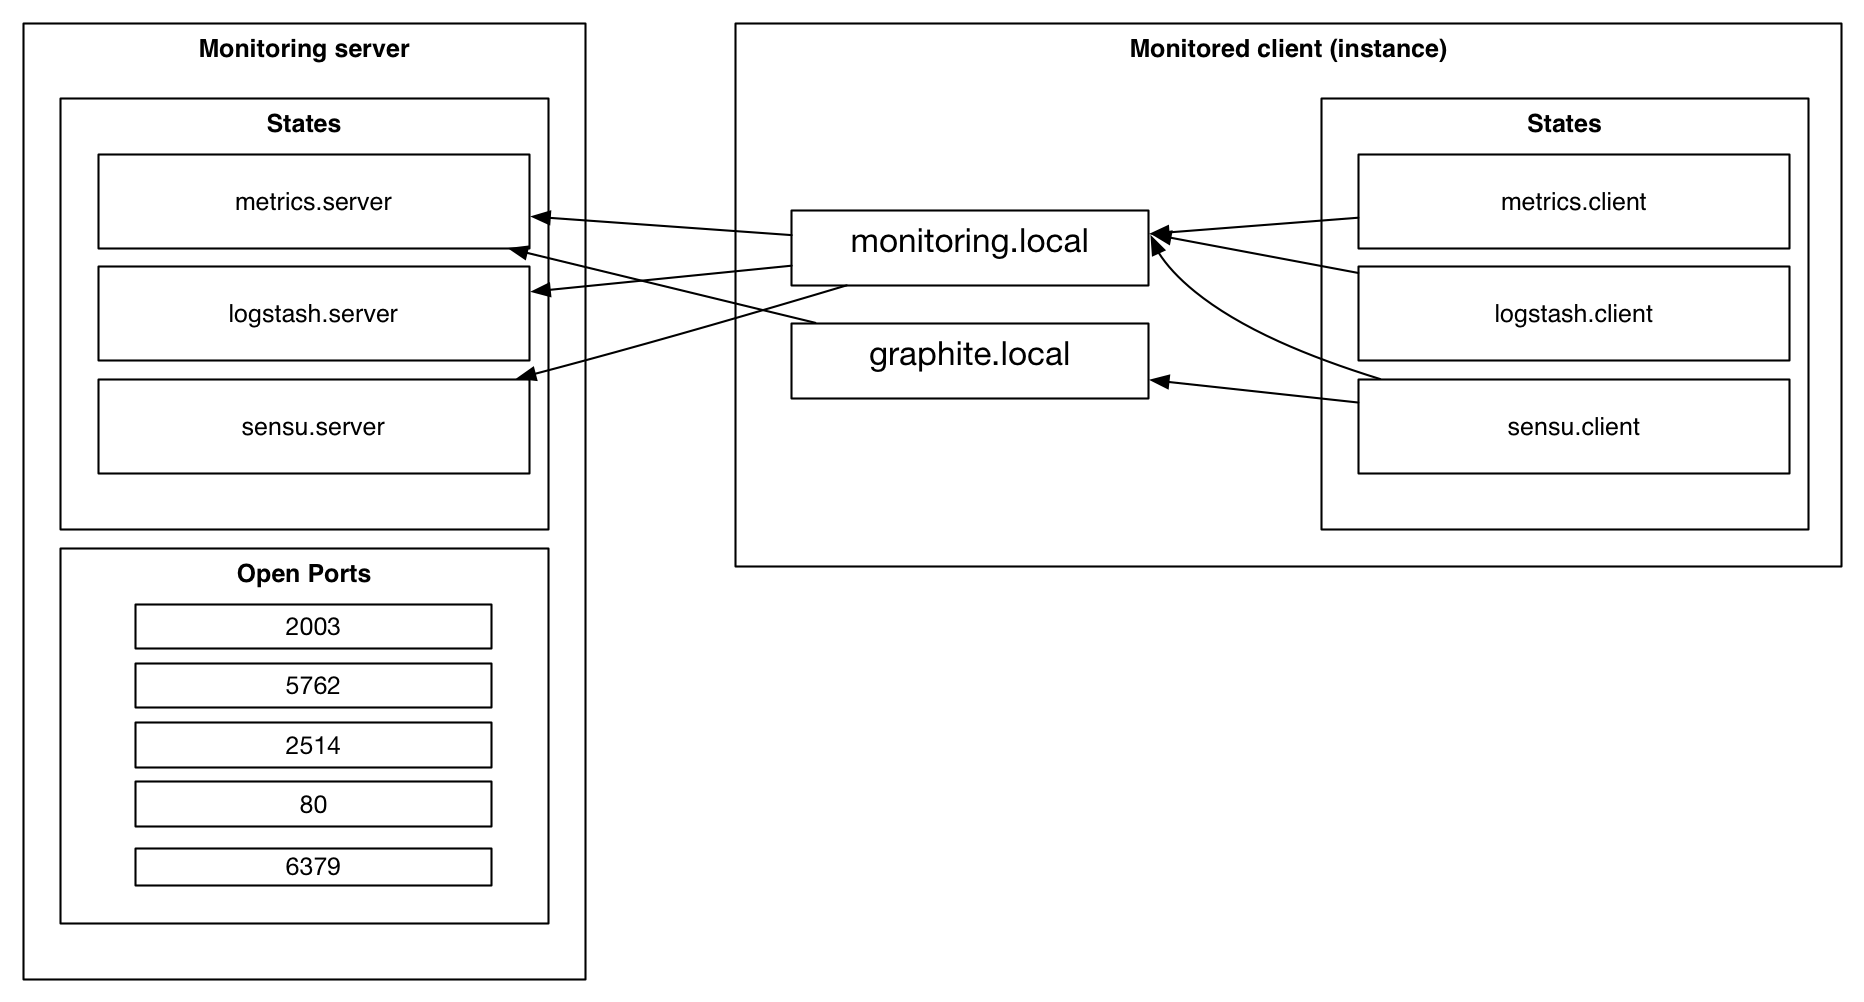
Set up this node to run the server side of the monitoring stack. It will pull in the following states from dependant formulas:
- metrics.server
- logstash.server
- sensu.server
The monitoring server requires the following ports to be open incoming from the clients:
- 80 (TCP)
- 2003 (TCP)
- 5762 (TCP)
- 6379 (TCP)
- 2514 (UDP)
This state will set up components to collect metrics (for the host via collectd, or apps via statsd), shipping logs to logstash (syslog handled automatically, app logs need to use the logship macro), and run checks (via sensu)
The client state pulls in the following states:
- metrics.client
- logstash.client
- sensu.client
See the formulas for more info on how to extend the componentes (to add extra checks, or ship extra logs for instance):
For everything to work properly we will need monitoring.local and graphite.local hosts file alias set up:
[internal IP of monitoring server] monitoring.local graphite.local