This document details how to install Netdata on an existing Kubernetes (k8s) cluster. By following these directions, you will use Netdata's Helm chart to create a Kubernetes monitoring deployment on your cluster.
The Helm chart installs one parent pod for storing metrics and managing alarm notifications, plus an additional
child pod for every node in the cluster, responsible for collecting metrics from the node, Kubernetes control planes,
pods/containers, and supported application-specific
metrics.
To deploy Kubernetes monitoring with Netdata, you need:
- A working cluster running Kubernetes v1.9 or newer.
- The kubectl command line tool, within one minor version difference of your cluster, on an administrative system.
- The Helm package manager v3.0.0 or newer on the same administrative system.
We recommend you install the Helm chart using our Helm repository. In the helm install command, replace netdata with
the release name of your choice.
helm repo add netdata https://netdata.github.io/helmchart/
helm install netdata netdata/netdata
Run kubectl get services and kubectl get pods to confirm that your cluster now runs a netdata service, one
parent pod, and multiple child pods.
You've now installed Netdata on your Kubernetes cluster. Next, it's time to opt-in and enable the powerful Kubernetes dashboards available in Netdata Cloud.
To start Kubernetes monitoring, you must first claim your Kubernetes cluster to Netdata Cloud. Claiming securely connects your Kubernetes cluster to stream metrics data to Netdata Cloud, enabling Kubernetes-specific visualizations like the health map and time-series composite charts.
First, find your claiming script in Netdata Cloud by clicking on your Space's dropdown, then Manage your Space.
Click the Nodes tab to reveal the netdata-claim.sh script for your Space in Netdata Cloud. You need the TOKEN
and ROOM values.
Next, create a file called override.yml.
touch override.ymlPaste the following into your override.yml file, replacing instances of ROOM and TOKEN with those from the
claiming script from Netdata Cloud. These settings claim your parent/child nodes to Netdata Cloud and store more
metrics in the nodes' time-series databases.
parent:
  claiming:
    enabled: true
    token: "TOKEN"
    rooms: "ROOM"

child:
  claiming:
    enabled: true
    token: "TOKEN"
    rooms: "ROOM"
  configs:
    netdata:
      data: |
        [global]
          memory mode = ram
          history = 3600
        [health]
          enabled = no
❗ These override settings, along with the Helm chart's defaults, will retain an hour's worth of metrics (
history = 3600, or3600 seconds) on each child node. Based on your metrics retention needs, and the resources available on your cluster, you may want to increase thehistorysetting.
Apply these new settings:
helm upgrade -f override.yml netdata netdata/netdataThe cluster terminates the old pods and creates new ones with the proper persistence and claiming configuration. You'll see your nodes, containers, and pods appear in Netdata Cloud in a few seconds.
If you don't need to configure your Netdata deployment, skip down to see how Kubernetes monitoring works in Netdata, in addition to more guides and resources.
Read up on the various configuration options in the Helm chart documentation if you need to tweak your Kubernetes monitoring.
Your first option is to create an override.yml file, if you haven't created one already for
claiming, then apply the new configuration to your cluster with helm upgrade.
helm upgrade -f override.yml netdata netdata/netdataIf you want to change only a single setting, use the --set argument with helm upgrade. For example, to change the
size of the persistent metrics volume on the parent node:
helm upgrade --set parent.database.volumesize=4Gi netdata netdata/netdataNetdata's service discovery, installed as part of the Helm chart installation, finds what services are running in a cluster's containers and automatically collects service-level metrics from them.
Service discovery supports popular applications and Prometheus endpoints.
If your cluster runs services on non-default ports or uses non-default names, you may need to configure service discovery to start collecting metrics from your services. You have to edit the default ConfigMap that is shipped with the Helmchart and deploy that to your cluster.
First, copy the default file to your administrative system.
curl https://raw.githubusercontent.com/netdata/helmchart/master/charts/netdata/sdconfig/child.yml -o child.ymlEdit the new child.yml file according to your needs. See the Helm chart
configuration and the file itself for details.
You can then run helm upgrade with the --set-file argument to use your configured child.yml file instead of the
default, changing the path if you copied it elsewhere.
helm upgrade --set-file sd.child.configmap.from.value=./child.yml netdata netdata/netdataNow that you pushed an edited ConfigMap to your cluster, service discovery should find and set up metrics collection from your non-default service.
If you update the Helm chart's configuration, run helm upgrade to redeploy your Netdata service, replacing netdata
with the name of the release, if you changed it upon installation:
helm upgrade netdata netdata/netdataTo update Netdata's Helm chart to the latest version, run helm repo update, then deploy upgrade it`:
helm repo update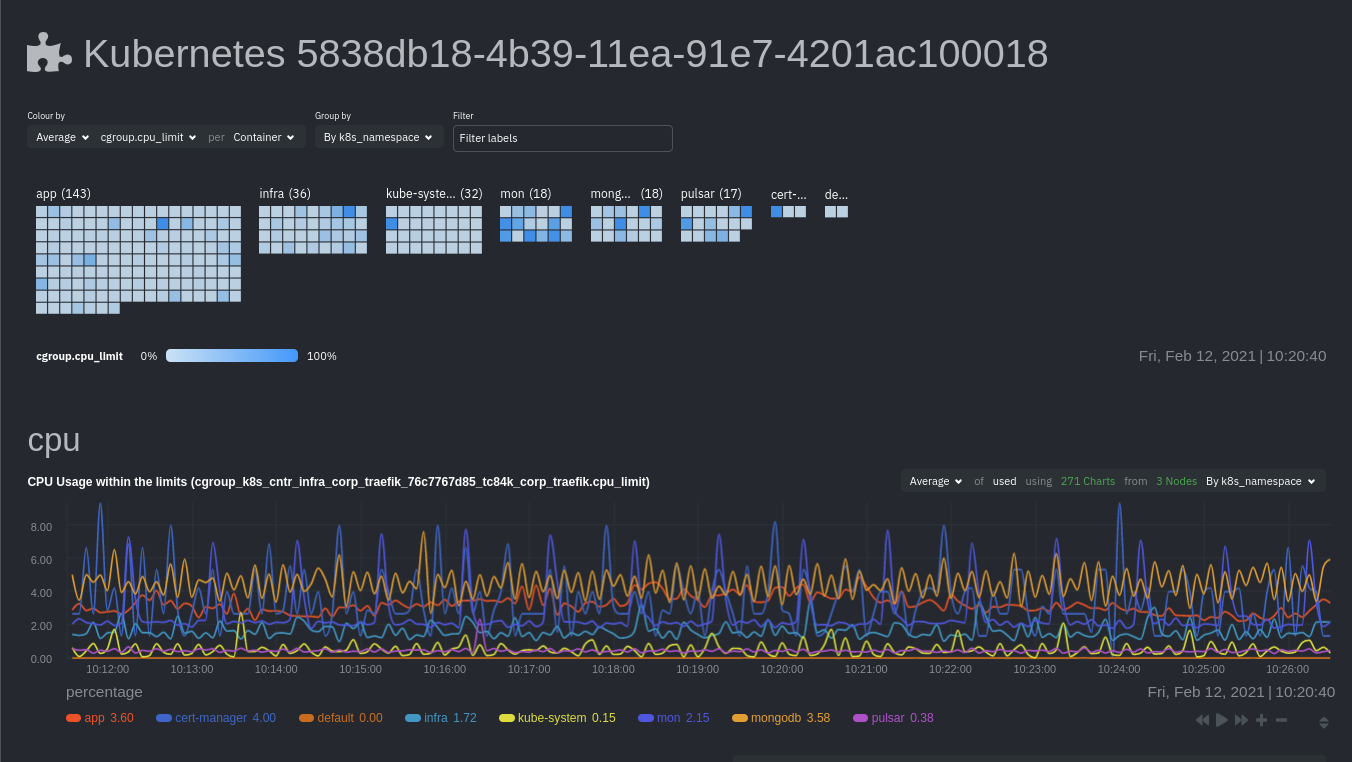
helm upgrade netdata netdata/netdataStart Kubernetes monitoring in Netdata Cloud, which comes with meaningful visualizations out of the box.
Read our guide, Kubernetes monitoring with Netdata: Overview and visualizations, for a complete walkthrough of Netdata's Kubernetes monitoring capabilities, including a health map of every container in your infrastructure, aggregated resource utilization metrics, and application metrics.