- CSV
- MatPlotLib
- Statistics
- Time
- Requests
This project aims to develop a Python script that requests financial data for a batch of 5 stock tickers from the Polygon API, saves this data into a CSV file, and generates a comprehensive report using the CSV data. The report includes the standard deviation of each stock's performance for the years 2021 and 2022.
The project is built using Python's built-in functions and modules, without relying on third-party libraries such as pandas or numpy. This is because the computing environment at Godel Trading does not include these modules.
# Importing Modules/Libraries.
# Python Script to pull Data from Polygon and Write to CSV files.

import csv
import requests
import time
from config import key

stocks = ["AAPL","DIS","TSLA","SBUX","HMC"]
for stock in stocks:
    url = f"https://api.polygon.io/v2/aggs/ticker/{stock}/range/1/day/2021-03-29/2022-05-25?adjusted=true&sort=asc&limit=300&apiKey={key}"
    data = requests.get(url)
    json_data = data.json()
    results = json_data['results']


# Creating empty list to store target data.
# Filtering out necessary components from json structure
    stock_data = []
    for day in results:
        closing_price = day['c']
        time_price = day['t']
        real_time = time.strftime('%Y-%m-%d', time.localtime(time_price/1000))


        dic = {
            'Date': real_time,
            'Closing_Price': closing_price,
        }
        stock_data.append(dic)
    # CSV module to write the the file locally.
        with open(f"{stock}.csv", "w", newline = '') as outfile:
            writer = csv.DictWriter(outfile, fieldnames=['Date','Closing_Price'])
            writer.writeheader()
            writer.writerows(stock_data)
Data and Output The project analyzes 5 stock tickers of your choice, for example, GOOG, AMZN, COUR, NFLX, and META. Daily stock data for these tickers will be retrieved from Polygon API for the period between March 29, 2021, and March 25, 2022, and saved into a CSV file. The CSV data will then be used to generate a report that contains the standard deviation of each stock's performance for both 2021 and 2022.
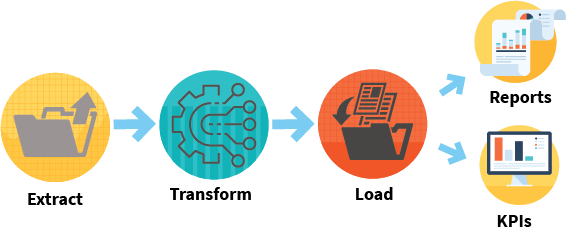
This project serves as an example of a data engineering pipeline that retrieves financial data from an API, stores it in a CSV file, and generates a report using Python's built-in modules and functions.
import statistics as stats
import matplotlib.pyplot as plt
import csv

# Reading CSV file with Dictreader
HMC_data = []
with open ("HMC.csv", "r") as infile:
    reader = csv.DictReader(infile)
    for row in reader:
        HMC_data.append(row)

i=0
HMC_stdev_data = []
# Structuring while Loop to get Days 1 - 5
while i <len(HMC_data):
    if i + 1 >= len(HMC_data) or i + 2 >= len(HMC_data) or i + 3 >= len(HMC_data) or i + 4 >= len(HMC_data):
        break
    Day_1 = float(HMC_data[i]["Closing_Price"])
    Day_2 = float(HMC_data[i+1]["Closing_Price"])
    Day_3 = float(HMC_data[i+2]["Closing_Price"])
    Day_4 = float(HMC_data[i+3]["Closing_Price"])
    Day_5 = float(HMC_data[i+4]["Closing_Price"])

    pop_stdev = stats.pstdev([Day_1,Day_2,Day_3,Day_4,Day_5])
    HMC_stdev_data.append(pop_stdev)
    i += 5
week = 0
for stdev in HMC_stdev_data:
    week += 1
    print(f"HMC Week {week} Standard Deviation is :{stdev}")
plt.plot(HMC_stdev_data)
plt.title("Stock Weekly Standard Deviation")
plt.ylabel("STD of CLOSING PRICE")
plt.savefig("HMCSTD.png")
plt.show()
# GoodBYE
