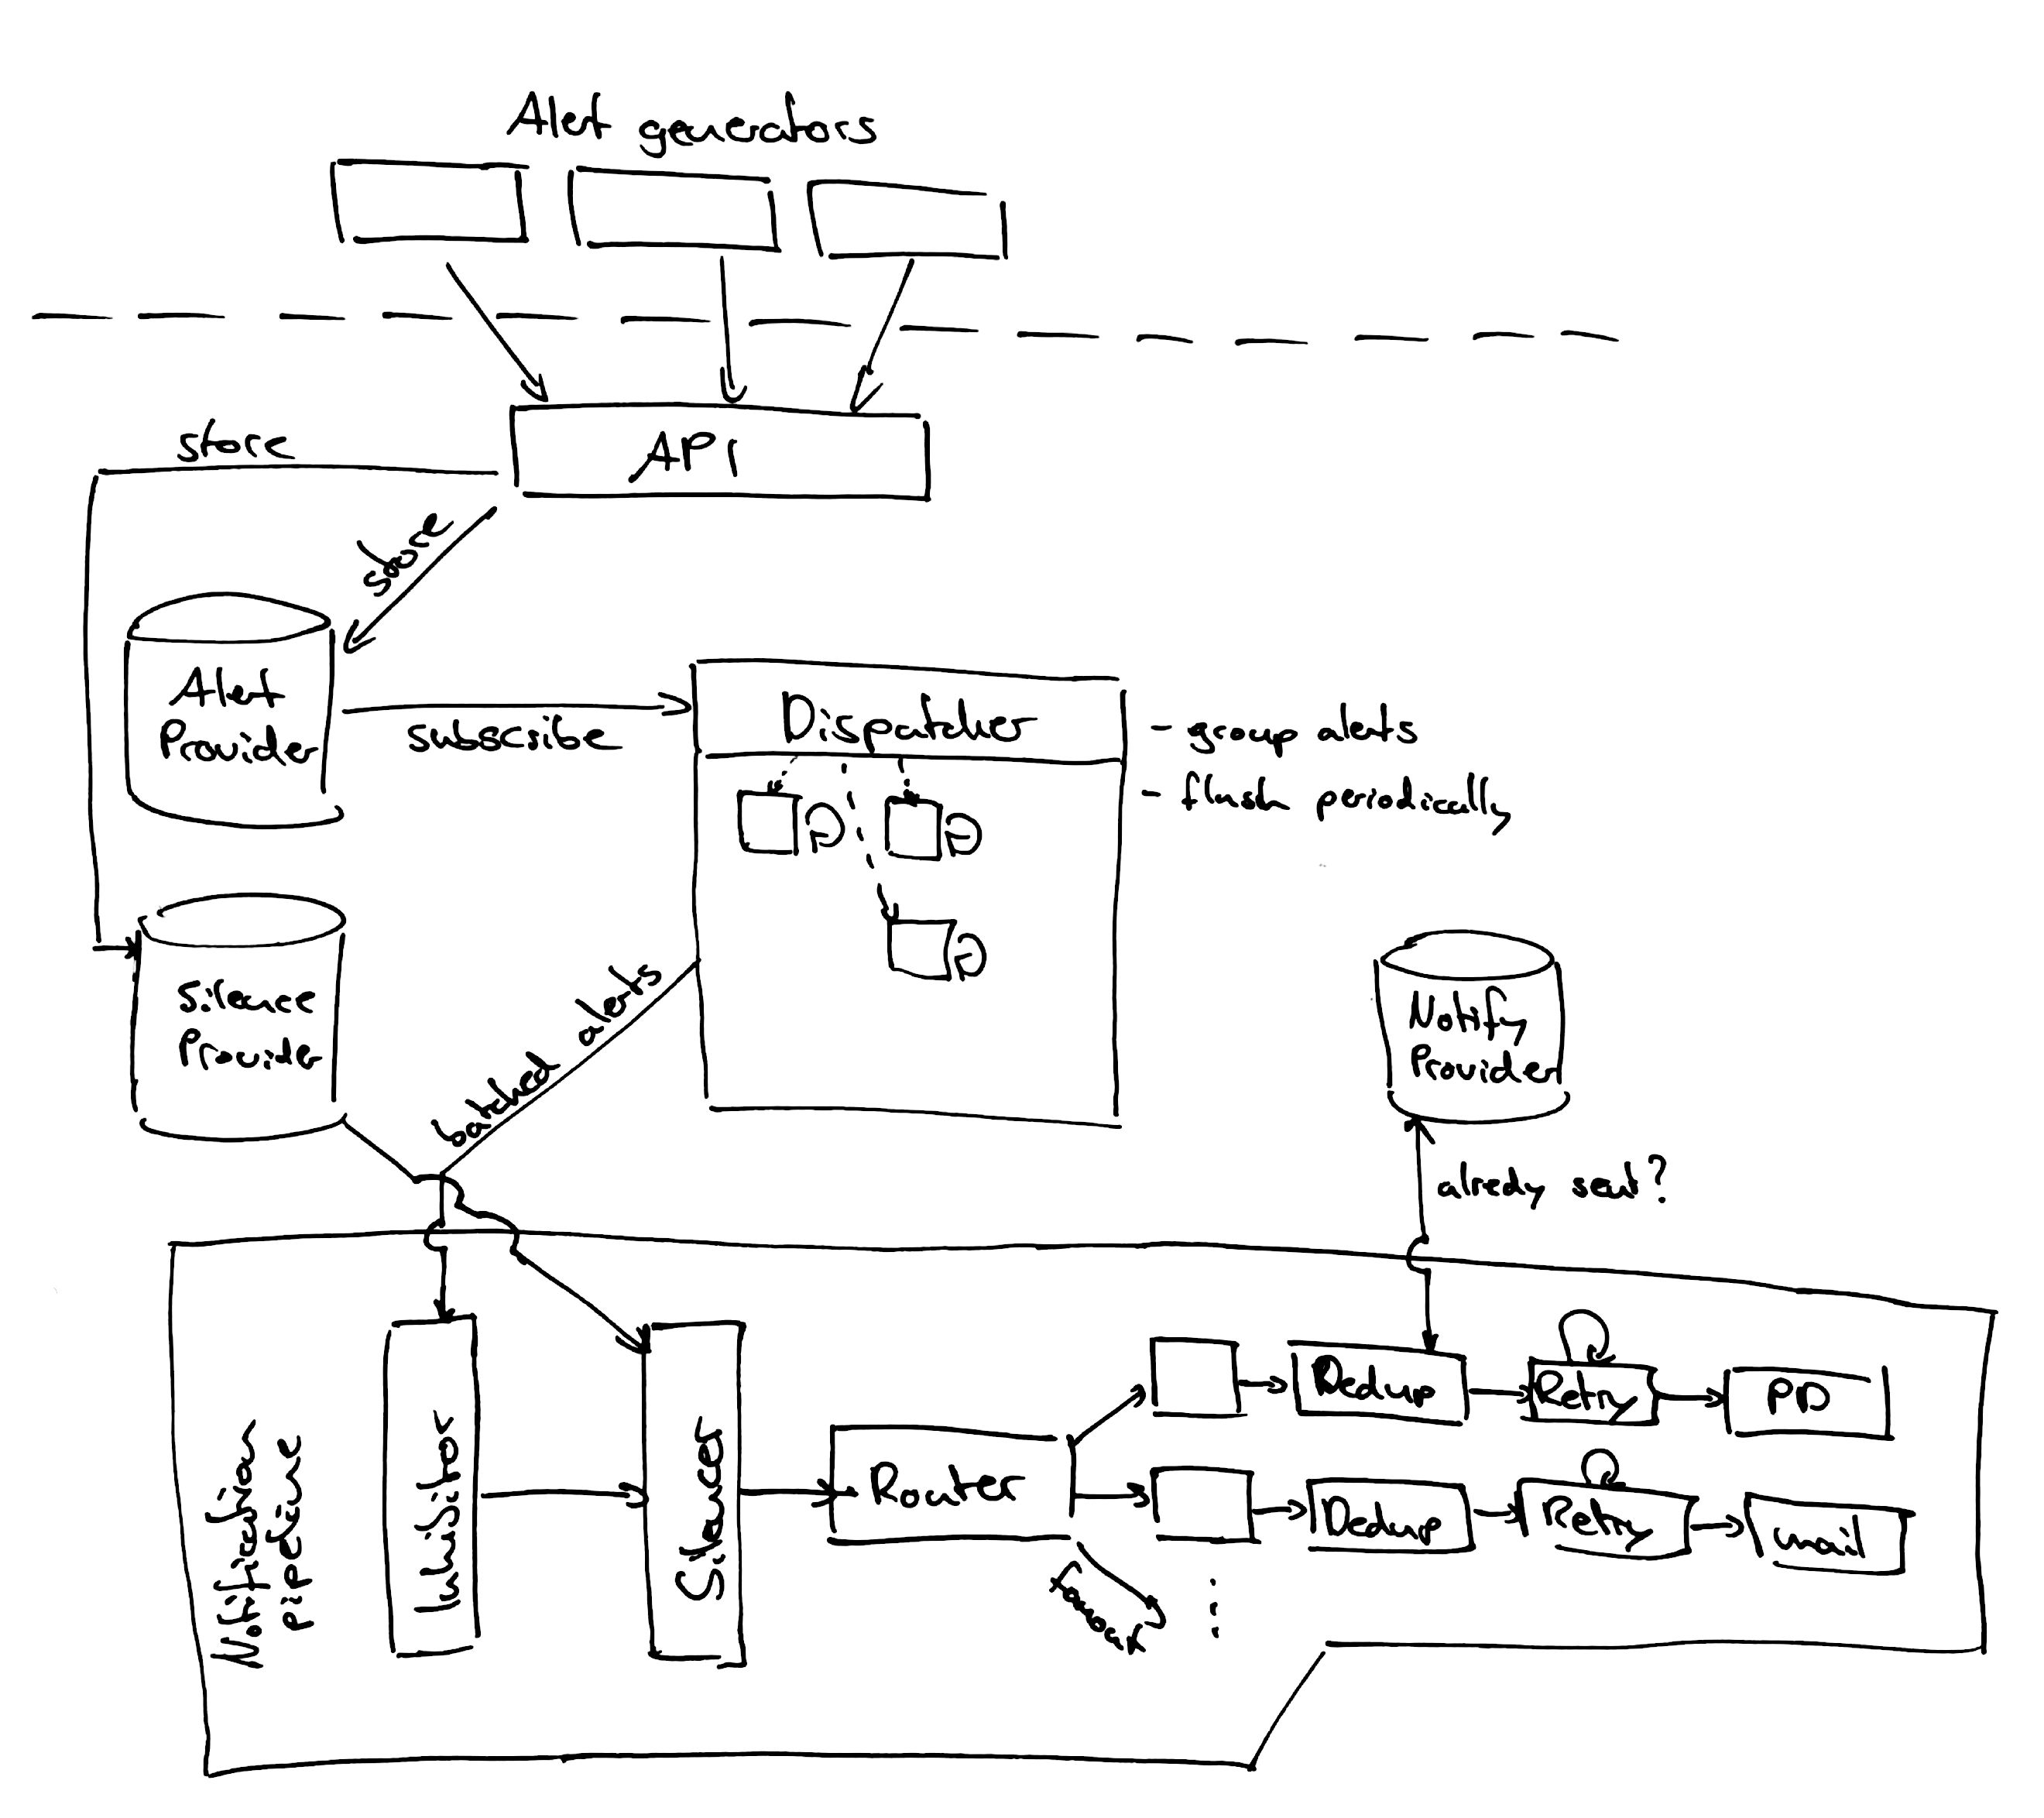
The Alertmanager handles alerts sent by client applications such as the Prometheus server. It takes care of deduplicating, grouping, and routing them to the correct receiver integrations such as email, PagerDuty, or OpsGenie. It also takes care of silencing and inhibition of alerts.
There are various ways of installing Alertmanager.
Precompiled binaries for released versions are available in the download section on prometheus.io. Using the latest production release binary is the recommended way of installing Alertmanager.
Docker images are available on Quay.io.
You can either go get it:
$ GO15VENDOREXPERIMENT=1 go get github.com/prometheus/alertmanager/cmd/...
# cd $GOPATH/src/github.com/prometheus/alertmanager
$ alertmanager -config.file=<your_file>
Or checkout the source code and build manually:
$ mkdir -p $GOPATH/src/github.com/prometheus
$ cd $GOPATH/src/github.com/prometheus
$ git clone https://github.com/prometheus/alertmanager.git
$ cd alertmanager
$ make build
$ ./alertmanager -config.file=<your_file>
You can also build just one of the binaries in this repo by passing a name to the build function:
$ make build BINARIES=amtool
This is an example configuration that should cover most relevant aspects of the new YAML configuration format. The full documentation of the configuration can be found here.
global:
  # The smarthost and SMTP sender used for mail notifications.
  smtp_smarthost: 'localhost:25'
  smtp_from: 'alertmanager@example.org'

# The root route on which each incoming alert enters.
route:
  # The root route must not have any matchers as it is the entry point for
  # all alerts. It needs to have a receiver configured so alerts that do not
  # match any of the sub-routes are sent to someone.
  receiver: 'team-X-mails'

  # The labels by which incoming alerts are grouped together. For example,
  # multiple alerts coming in for cluster=A and alertname=LatencyHigh would
  # be batched into a single group.
  group_by: ['alertname', 'cluster']

  # When a new group of alerts is created by an incoming alert, wait at
  # least 'group_wait' to send the initial notification.
  # This way ensures that you get multiple alerts for the same group that start
  # firing shortly after another are batched together on the first
  # notification.
  group_wait: 30s

  # When the first notification was sent, wait 'group_interval' to send a batch
  # of new alerts that started firing for that group.
  group_interval: 5m

  # If an alert has successfully been sent, wait 'repeat_interval' to
  # resend them.
  repeat_interval: 3h

  # All the above attributes are inherited by all child routes and can
  # overwritten on each.

  # The child route trees.
  routes:
  # This routes performs a regular expression match on alert labels to
  # catch alerts that are related to a list of services.
  - match_re:
      service: ^(foo1|foo2|baz)$
    receiver: team-X-mails

    # The service has a sub-route for critical alerts, any alerts
    # that do not match, i.e. severity != critical, fall-back to the
    # parent node and are sent to 'team-X-mails'
    routes:
    - match:
        severity: critical
      receiver: team-X-pager

  - match:
      service: files
    receiver: team-Y-mails

    routes:
    - match:
        severity: critical
      receiver: team-Y-pager

  # This route handles all alerts coming from a database service. If there's
  # no team to handle it, it defaults to the DB team.
  - match:
      service: database

    receiver: team-DB-pager
    # Also group alerts by affected database.
    group_by: [alertname, cluster, database]

    routes:
    - match:
        owner: team-X
      receiver: team-X-pager

    - match:
        owner: team-Y
      receiver: team-Y-pager


# Inhibition rules allow to mute a set of alerts given that another alert is
# firing.
# We use this to mute any warning-level notifications if the same alert is
# already critical.
inhibit_rules:
- source_match:
    severity: 'critical'
  target_match:
    severity: 'warning'
  # Apply inhibition if the alertname is the same.
  equal: ['alertname']


receivers:
- name: 'team-X-mails'
  email_configs:
  - to: 'team-X+alerts@example.org'

- name: 'team-X-pager'
  email_configs:
  - to: 'team-X+alerts-critical@example.org'
  pagerduty_configs:
  - service_key: <team-X-key>

- name: 'team-Y-mails'
  email_configs:
  - to: 'team-Y+alerts@example.org'

- name: 'team-Y-pager'
  pagerduty_configs:
  - service_key: <team-Y-key>

- name: 'team-DB-pager'
  pagerduty_configs:
- service_key: <team-DB-key>amtool is a cli tool for interacting with the alertmanager api. It is bundled with all releases of alertmanager.
Alternatively you can install with:
go get github.com/prometheus/alertmanager/cmd/amtool
View all currently firing alerts
$ amtool alert
Alertname        Starts At                Summary
Test_Alert       2017-08-02 18:30:18 UTC  This is a testing alert!
Test_Alert       2017-08-02 18:30:18 UTC  This is a testing alert!
Check_Foo_Fails  2017-08-02 18:30:18 UTC  This is a testing alert!
Check_Foo_Fails  2017-08-02 18:30:18 UTC  This is a testing alert!
View all currently firing alerts with extended output
$ amtool -o extended alert
Labels                                        Annotations                                                    Starts At                Ends At                  Generator URL
alertname="Test_Alert" instance="node0"       link="https://example.com" summary="This is a testing alert!"  2017-08-02 18:31:24 UTC  0001-01-01 00:00:00 UTC  http://my.testing.script.local
alertname="Test_Alert" instance="node1"       link="https://example.com" summary="This is a testing alert!"  2017-08-02 18:31:24 UTC  0001-01-01 00:00:00 UTC  http://my.testing.script.local
alertname="Check_Foo_Fails" instance="node0"  link="https://example.com" summary="This is a testing alert!"  2017-08-02 18:31:24 UTC  0001-01-01 00:00:00 UTC  http://my.testing.script.local
alertname="Check_Foo_Fails" instance="node1"  link="https://example.com" summary="This is a testing alert!"  2017-08-02 18:31:24 UTC  0001-01-01 00:00:00 UTC  http://my.testing.script.local
In addition to viewing alerts you can use the rich query syntax provided by alertmanager
$ amtool -o extended alert query alertname="Test_Alert"
Labels                                   Annotations                                                    Starts At                Ends At                  Generator URL
alertname="Test_Alert" instance="node0"  link="https://example.com" summary="This is a testing alert!"  2017-08-02 18:31:24 UTC  0001-01-01 00:00:00 UTC  http://my.testing.script.local
alertname="Test_Alert" instance="node1"  link="https://example.com" summary="This is a testing alert!"  2017-08-02 18:31:24 UTC  0001-01-01 00:00:00 UTC  http://my.testing.script.local

$ amtool -o extended alert query instance=~".+1"
Labels                                        Annotations                                                    Starts At                Ends At                  Generator URL
alertname="Test_Alert" instance="node1"       link="https://example.com" summary="This is a testing alert!"  2017-08-02 18:31:24 UTC  0001-01-01 00:00:00 UTC  http://my.testing.script.local
alertname="Check_Foo_Fails" instance="node1"  link="https://example.com" summary="This is a testing alert!"  2017-08-02 18:31:24 UTC  0001-01-01 00:00:00 UTC  http://my.testing.script.local

$ amtool -o extended alert query alertname=~"Test.*" instance=~".+1"
Labels                                   Annotations                                                    Starts At                Ends At                  Generator URL
alertname="Test_Alert" instance="node1"  link="https://example.com" summary="This is a testing alert!"  2017-08-02 18:31:24 UTC  0001-01-01 00:00:00 UTC  http://my.testing.script.local
Silence an alert
$ amtool silence add alertname=Test_Alert
b3ede22e-ca14-4aa0-932c-ca2f3445f926

$ amtool silence add alertname="Test_Alert" instance=~".+0"
e48cb58a-0b17-49ba-b734-3585139b1d25
View silences
$ amtool silence query
ID                                    Matchers              Ends At                  Created By  Comment
b3ede22e-ca14-4aa0-932c-ca2f3445f926  alertname=Test_Alert  2017-08-02 19:54:50 UTC  kellel

$ amtool silence query instance=~".+0"
ID                                    Matchers                            Ends At                  Created By  Comment
e48cb58a-0b17-49ba-b734-3585139b1d25  alertname=Test_Alert instance=~.+0  2017-08-02 22:41:39 UTC  kellel
Expire a silence
$ amtool silence expire b3ede22e-ca14-4aa0-932c-ca2f3445f926
Expire all silences matching a query
$ amtool silence query instance=~".+0"
ID                                    Matchers                            Ends At                  Created By  Comment
e48cb58a-0b17-49ba-b734-3585139b1d25  alertname=Test_Alert instance=~.+0  2017-08-02 22:41:39 UTC  kellel

$ amtool silence expire $(amtool silence -q query instance=~".+0")

$ amtool silence query instance=~".+0"
Expire all silences
$ amtool silence expire $(amtool silence query -q)
Amtool allows a config file to specify some options for convenience. The default config file paths are $HOME/.config/amtool/config.yml or /etc/amtool/config.yml
An example configfile might look like the following:
# Define the path that amtool can find your `alertmanager` instance at
alertmanager.url: "http://localhost:9093"

# Override the default author. (unset defaults to your username)
author: me@example.com

# Force amtool to give you an error if you don't include a comment on a silence
comment_require: true

# Set a default output format. (unset defaults to simple)
output: extended
Warning: High Availability is under active development
To create a highly available cluster of the Alertmanager the instances need to
be configured to communicate with each other. This is configured using the
-mesh.* flags.
-mesh.peer-idstring: mesh peer ID (default "<hardware-mac-address>")-mesh.listen-addressstring: mesh listen address (default "0.0.0.0:6783")-mesh.nicknamestring: mesh peer nickname (default "<machine-hostname>")-mesh.peervalue: initial peers (repeat flag for each additional peer)
The mesh.peer-id flag is used as a unique ID among the peers. It defaults to
the MAC address, therefore the default value should typically be a good option.
The same applies to the default of the mesh.nickname flag, as it defaults to
the hostname.
The chosen port in the mesh.listen-address flag is the port that needs to be
specified in the mesh.peer flag of the other peers.
To start a cluster of three peers on your local machine use goreman and the
Procfile within this repository.
goreman start
To point your prometheus instance to multiple Alertmanagers use the
-alertmanager.url parameter. It allows passing in a comma separated list.
Start your prometheus like this, for example:
./prometheus -config.file=prometheus.yml -alertmanager.url http://localhost:9095,http://localhost:9094,http://localhost:9093
Note: make sure to have a valid
prometheus.ymlin your current directory
Important: Do not load balance traffic between Prometheus and its Alertmanagers, but instead point Prometheus to a list of all Alertmanagers. The Alertmanager implementation expects all alerts to be sent to all Alertmanagers to ensure high availability.
Refer to ui/app/CONTRIBUTING.md.