
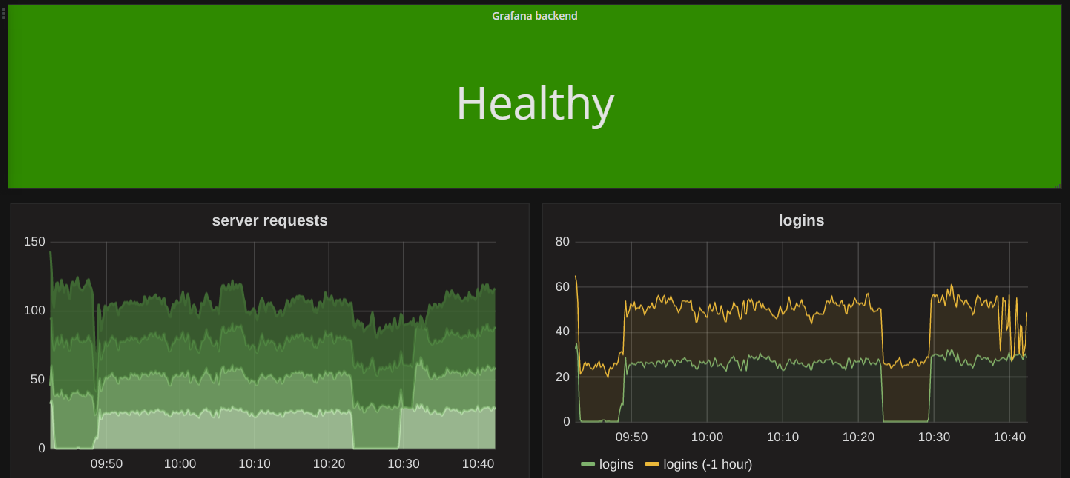
Grafana is very nice and cool and allows you to monitor your infrastructure displaying various metrics. The problem is that when the backend of Grafana becomes unreachable due to either network problems or something else, it's quite difficult to notice that the page is disconnected and doesn't reflect the latest state of your system.
It looks very simple, it's just a panel with a text on it. When the backend is reachable, the panel is green and healthy. When the backend is not reachable, the panel becomes red and should attract your attention.
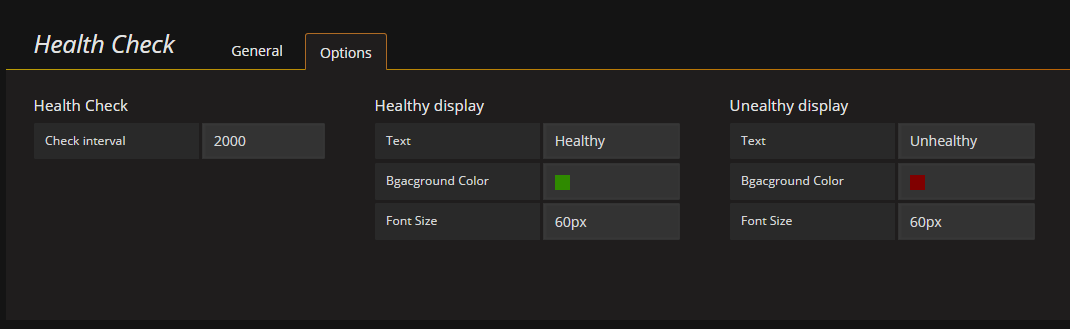
It works very simply, the plugin implements a health monitoring of the Grafana backend by making regular HEAD requests to its root. The user can change the interval of the requests as well as the background color and text of the healthy and unhealthy states.
In order to build the plugin, you need to have Node.js/npm and git installed.
Clone a copy of the main git repo by running:
git clone git://github.com/anisimovsergey/health-check-panel.gitInstall the dependencies:
npm installRun eslint:
npm run lintRun the build script:
npm run buildThe built version of the plugin will be put in the dist/ subdirectory.