This class offers an easy way to transform Python regression output (linearmodels, statsmodels) into a LaTeX table. Moreover, it allows to combine multiple regression models into a unified table. An example table is presented below.
To use the class, create an instance of a class instance with table features, variables names, and variables order passed as parameters.
import texression
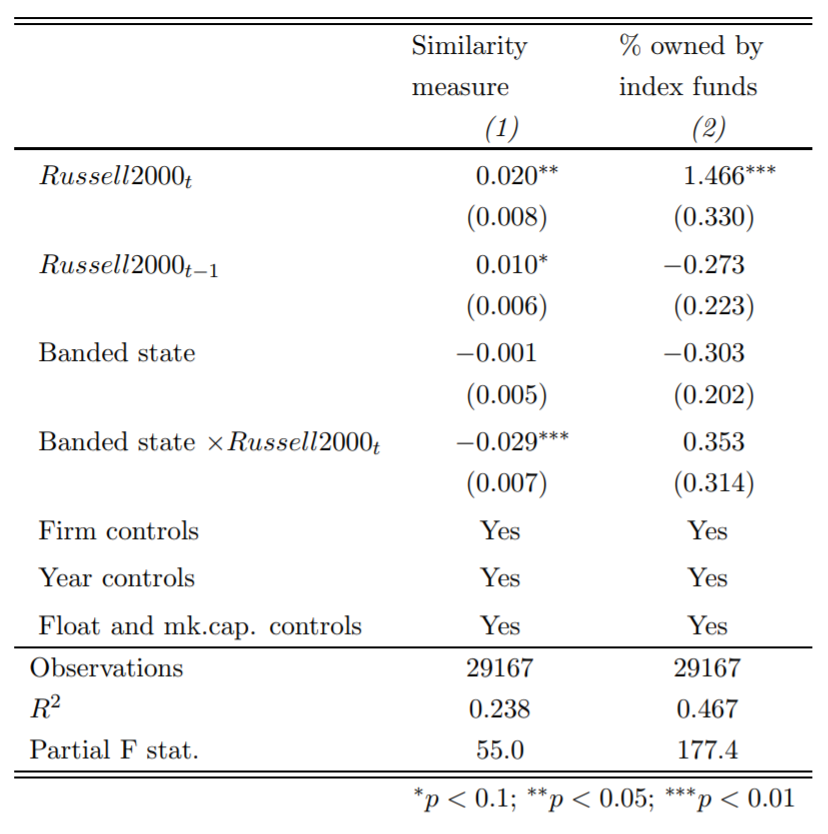
tx = texression.texression(varnames, varorder, ltcaption = """First stage of 2SLS regression.""")Here varnames is a dictionary that converts variable names into human readable (the ones that appear in the LaTeX table) variable names.
varnames = {'t1' : '$Russell 2000_{t}$',
            't0' : '$Russell 2000_{t-1}$',
            'banded' : 'Banded state',
            'banded_t1' : 'Banded state $\\times Russell 2000_{t}$'
           }
And varorder is a list that determines the order of variables appearing in the table.
varorder = ['t1', 't0', 'banded', 'banded_t1',
           {'name' : 'Firm controls', 'type' : 'controls',
            'vars' :['NonIndxOwn', 'ISSrec_For', 'log_atq', 'roa', 'bm_ratio', 'firm_leverage']},
           {'name' : 'Year controls', 'type' : 'controls',
            'vars' : ['y_2010', 'y_2011', 'y_2012', 'y_2013', 'y_2014', 'y_2015', 'y_2016']},
           {'name' : 'Float and mk.cap. controls', 'type' : 'controls',
            'vars' : ['mkcap', 'float_value_t1']},
           {'type' : 'silent', 'vars' : ['const']}]
The varorder parameter also allows to group variables (if complete group is present, then "Yes" is displayed) under an alternative caption; and to forcibly hide variables from being shown (if regression contains variable not mentioned in varnames/varorder then it is still displayed in the table).
Once an class instance is created, it can absorb regression results with add_regression method:
from linearmodels import OLS

tx.add_regression(OLS(...).fit(), 'Similarity measure')
tx.add_regression(OLS(...).fit(), '\% owned by index funds')
And then save the constructed LaTeX table to file with the latex method:
tx.latex('FSLS_presentation.tex') # saves LaTeX table to 'FSLS_presentation.tex' file- Multiple regressions per table
- Ordering of variables and human readable variables' names
- Ability to group sets of variables to save space (e.g. controls)
- Ability to hide variables from being displayed (e.g. constant)
- Centering of values displayed "by the dot"
- Multi-page support
- Table sectioning
Examples are available in this pdf.