Final Project: Analyzed language in articles from different news sources to classify content by political voice and provide the subjectivity of each article.
For my final project at Flatiron School I built an interactive dashboard in Jupyter to consolidate articles, podcasts and videos based on a search term. In addition to this I created the two following classification models, which are built into the dashboard.
- Random Forest classifier to seperate articles by political voice (right, left, center).
- Naive Bayes classifier to categorize a sentence as being subjective or objective. Each sentence is categorized when the article is pulled in and the user gets the percent of subjectivity of the articles from each political voice.
The video below shows the functionality of the Jupyter Dashboard:
-
My objective for the dashboard was to provide users with a diverse mix of content in terms of mediums and point of view. Additionally, I wanted to provide readers with insights to the articles before they were read by stating the subjectivity %. This could help a reader identify if they should be exploring other options to get facts about the topic.
-
I wanted to see if there are any trends in the way certain sources cover different topics in terms of subjectivity. I also wanted to see if it was possible to see a distinction between the overall voice of the left, right and center.
Overall I used 3 different datasets for the following purposes.
- Set of 12,000 articles used to train Doc2Vec model and right, left center classification model.
- Set of 24,000 articles & amazon reviews (12K of each) used to train objective vs subjective sentence classification model.
- Scraped data used to populate the live dashboard.
For all the articles scraped I utilized NewsAPI, which provided me with URL's to articles based on a search query (topic or source name). Link to NewsAPI documentation https://newsapi.org/sources.
To label objective vs subjective sentences I used the part of speech tagger in NLTK to flag any sentences with specific parts of speech commonly used in subjective sentences. These included:
- predeterminers (all the kids).
- comparative and superlative adverb (better, best).
- comparative and superlative adjectives (bigger, biggest).
I then trained a simple Naive Bayes classifier with the sentences containing these parts of speech labeled as subjective.
Before moving into my EDA I want to address that this was only the first step in trying to classify subjective sentences. I clearly have a finger on the scale since I am defining a subjective sentence as those containing certain parts of speech. However, I was able to gather some insights from my EDA that will help strengthen this model. I will go deeper into my next steps identified in my EDA, but my first step moving forward:
- Pull sentences from Wikipedia (more objective) and try to find trends in the commonly used parts of speech.
Once I had my Naive Bayes classifier I pulled 4,000 articles to analyze any trends in subjectivity accross different sources related different topics.
Features added to text:
- Ran each sentence through my classifier to get the total objective and subjective sentences. Additionally, the percent of subjectivity in the article.
- Used vader sentiment in nltk and TEXTBLOB to get the polarity of each article and the textblob subjectivity.
- Utilized NLTK part of speech tagging to get the main subject and sub-topic of each article.
- Vectorized each of the topics and sub-topics using a pre-trained word2vec model.
- Carry out k-means clustering on word embeddings to group similar topics into buckets.
- Perform PCA to reduce dimensionality of the embeddings to visualize them. Below is the graph using two principal components.

The results from Word2Vec were pretty great. As you can see in the top right corner Djokovic, Nadal and Federer are all grouped together (all tennis players). Additionally, the main topics in some of the clusters were perfect. 3 of my 6 clusters are shown below. As you can see Serena Williams and Tiger Woods were grouped together. Cluster 1 seems to be identifying entities and cluster 2 locations.

Once I had my features together I sifted through the data to try to find some relationships between the subjectivity and other features I added. The most interesting info I found is shown in the two the graphs below. The y-axis of both graphs show the percent subjectivity from my classifier. Both graphs are showing the subjectivity for ONLY articles with Donald Trump as the main topic.

The graph above shows that the center has the lowest subjectivity on average and the right has the highest. This intuitively made sense to me so I think I can build off of my model to strengthen it even more.
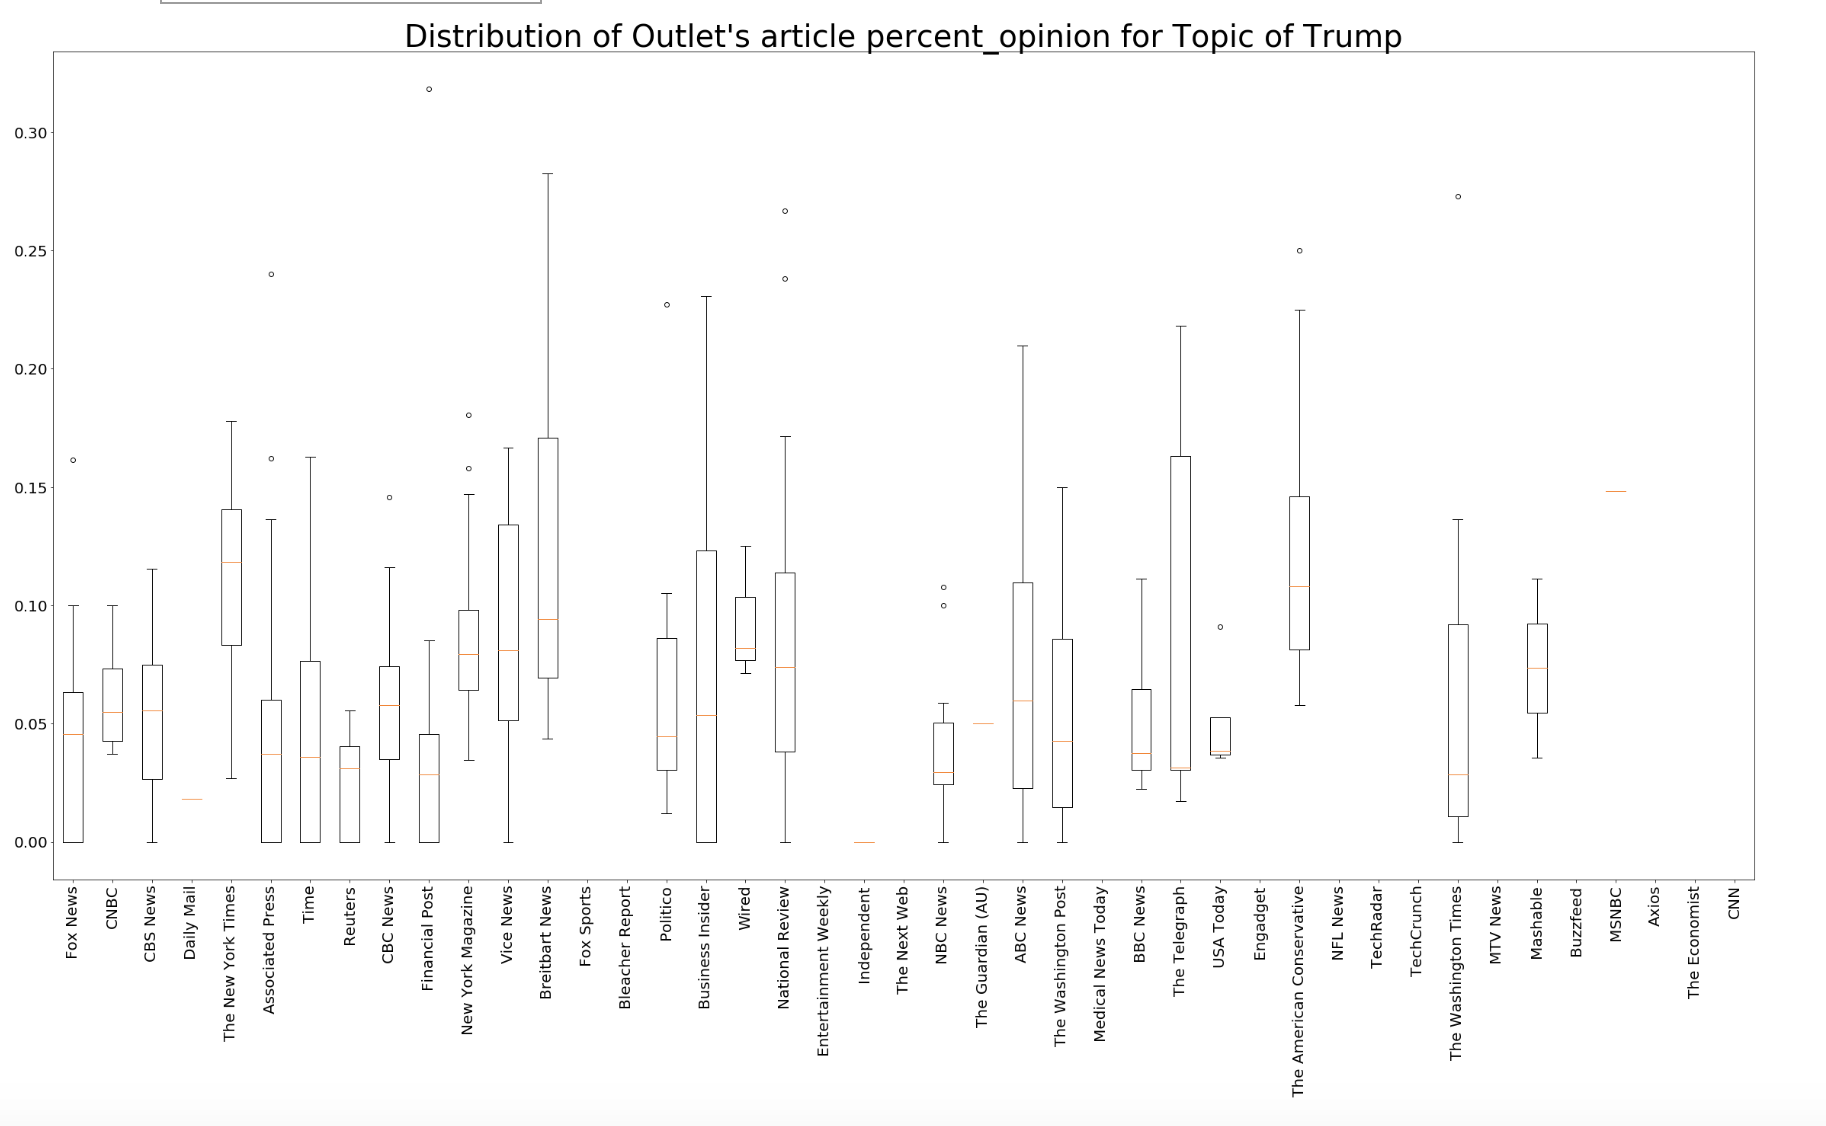
The above graph shows the subjectivity across every source in my corpus. Breitbart has the highest average subjectivity which intuitively makes sense, but my next steps will be digging into these articles to confirm.
-
Dig deeper into each news source's articles about Donald Trump and try to gain context around the percent subjectivity. Need to confirm how often the sentences classified as subjective are actually subjective.
-
Try to find the parts of speech most often used in the most subjective articles.
In order to label my articles I scraped the classification of left, right and center from https://mediabiasfactcheck.com/. This site classifies news sources as being left, center or right bias. I decided to label anything as left-center or right center as simply center for my task. Below are the sources and labels I used:

Overall I trained 10 different Doc2Vec models on my data using different combinations of trigram or bigram vocabulary creation and different Doc2Vec model types (Distributed Memory and Distributed Bag of Words).
The image below does a great job highlighting the difference between bag of words and distributed memory.

- Tokenize documents using nltk's Regular Expressions Tokenizer.
- Create bigram or trigram tagger to identify the most used phrases in the corpus. This will add these phrases to the vocabulary from each document if present.
- Tag each document with appropriate tags. The three tags I used were a unique document tag, a perspective tag (left, right, center) and a source tag (WSJ, NYT, etc.).

- Choose Doc2Vec model and train.
To visualize the work done in Doc2Vec I reduced the dimensionality of the vectorized documents using PCA. As you can see below we get a nice visual of the vectorized documents from one of the trained models. Doc2Vec also creates a universal vector for each perspective (green points) and each source (blue points).

While, PCA is helpful in understanding what Doc2Vec is doing behind the scenes- the chart below shows the explained variance of using specific amounts of principal components. Using 3 principal components only explains about 20% of the variance in this case so the vectors being visualized are not showing the full story.

For each Doc2Vec model I ran a grid search to get the best hyper-parameters for a Logistic Regression, Random Forest, Decision Tree, AdaBoost and Naive Bayes classifier. I had a slight class imbalance so I used SMOTE to add artificial vectors to the left category, making the split roughly 33% per class.
Overall the best validation set accuracy score was from a Random Forest classification (validation set was a new set of 100 articles scraped from the web seperated from test train split). The accuracy between 35%-38% for left, right and center (barely better than random guessing). These were generally the numbers accross each classification model.
To keep track of all models I created a dynamic dashboard to plot the confusion matrix of each (below for decision tree).

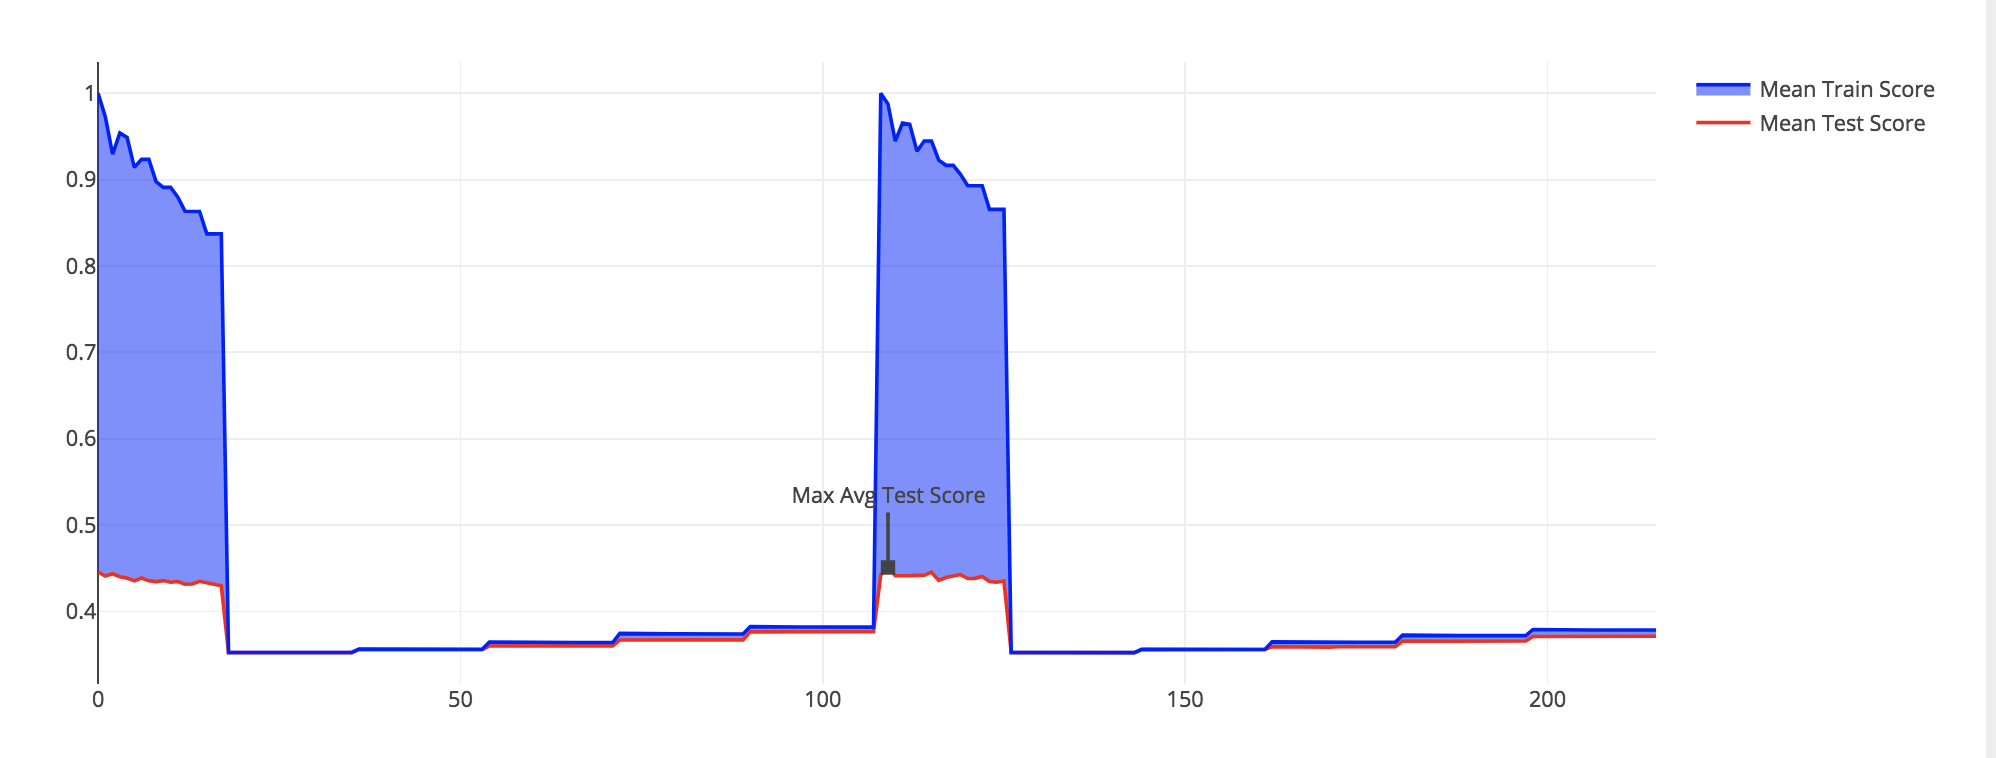
Additionally, the test and train score difference for each iteration of the grid search was plotted to help spot potential overfitting. This is shown below for my Decision Tree models. As you can see some of the iterations are overfit where there are spikes in the top line (training accuracy). After investigating I realized the decision trees without a set max depth were being overfit and I adjusted my models accordingly.
- I would like to try TF-IDF to create my document vectors as opposed to Doc2Vec. Since Doc2Vec is a blackbox model it was very difficult to interpret the feature importances the classification models had. This made it tough to find potential ways to strengthen model. TF-IDF would help me visualize what features were most important for the classification process and which words were most prominent across the different classes.
- Manual classification of documents is needed. It is a huge assumption to make that all New York Times articles are from a centered voice. This context was lost in my analysis and I think stronger labels could improve models.