MbedSysview is a library that connects the Mbed OS task scheduler to the SEGGER SystemView profiling & analysis software. SystemView is an amazingly useful tool which shows a complete picture of all task executions, thread switches, and other events of interest in your application. It works by having code running on the target log messages to a low-overhead buffer when events such as task switches occur. These events are then read out over a J-Link debugger and processed by the host application to generate a complete picture of activity on the device. The library is extremely efficient and can log tens of thousands of events per second with microsecond timing accuracy.
- Show all the thread activity in your application
- Profile thread executions and other events of interest with microsecond accuracy and very little overhead
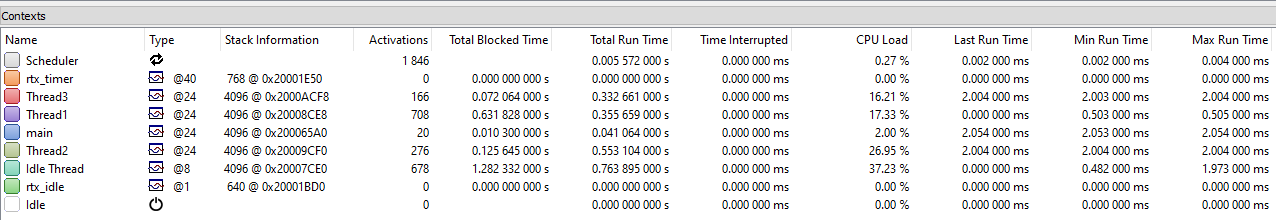
- Display aggregate statistics, such as how much CPU each thread is consuming and how long it runs for on each execution
- Be extended to display custom information, such as markers for events and printouts from the application
- Provide an extremely handy way to visualize and debug resource issues on embedded systems!
- MCU that is supported by SEGGER J-Link
- Any standalone J-Link debug probe, or a dev board with a J-Link On-Board
- Many Mbed boards, such as STM32 Nucleo boards, can have alternate firmware loaded that converts their debuggers into a J-Link On-Board. Instructions for Nucleo boards
- License for SEGGER SystemView. SystemView is free for educational and hobby use. For commercial use it costs roughly $1000 per seat.
First thing's first: for this library to work, you need to be using Mbed OS, not Mbed Bare-Metal. It won't compile without access to certain RTOS functions. Also, you need to use the following option in your mbed-app.json:
"rtos.enable-all-rtx-events": 1If you do not have this option, thread data will not properly be recorded!
For reference, a complete mbed_app.json for your project might look like:
{
    "target_overrides": {
        "*": {
            "platform.stdio-baud-rate": 115200,
            "platform.stdio-buffered-serial": 1,
            "rtos.enable-all-rtx-events": 1
        }
    }
}This codebase is designed to work out-of-the-box with mbed-cmake. However, it should be possible to use with the other Mbed build systems with a bit of work.
Integrating with mbed-cmake is easy: just drop the MbedSysview and SEGGER-SystemView folders from this project into your project, then add them as CMake subdirectories. Then, link to the library with
target_link_libraries(YourApplication MbedSysview)Note that two options will need to be configured, either in your CMake scripts or by passing -D flags on the command line:
SYSVIEW_USE_MBED_US_TICKER
If enabled, SystemView will be configured to use the Mbed OS us ticker for timestamps. This can be slower as it means a call to us_ticker_read() each time an event is recorded, and it also limits timestamp resolution to 1us. However, it works on all devices supported by Mbed. If the option is disabled, the CPU cycle counter will be used. This is super fast and higher resolution but only supports Cortex M3, M4, and M7.
MBED_SYSVIEW_APP_NAME
This sets the name of your application as displayed in the SystemView viewer. If unset, the name of the CMake project will be used.
For Mbed CLI 1, you should just be able to copy all the source files under the SEGGER-SystemView and MbedSysview folders into your project and Mbed CLI will build them. However, you may also need to edit MbedSysview.cpp to hardcode values of the options (see above).
TODO.
Once you have the code in your project, integrating MbedSysview is easy. All you need to do is create an MbedSysview object (it can be on the stack or global), then call begin() on it near the start of your program. That's it! SystemView can now connect to your application and record events.
A basic example main would look like:
#include <mbed.h>
#include "MbedSysview.h"
MbedSysview sysview;
int main()
{
sysview.begin();
// optional: wait for viewer to connect if you want to capture the start events
//sysview.waitForViewer();
// start your threads...
// do stuff...
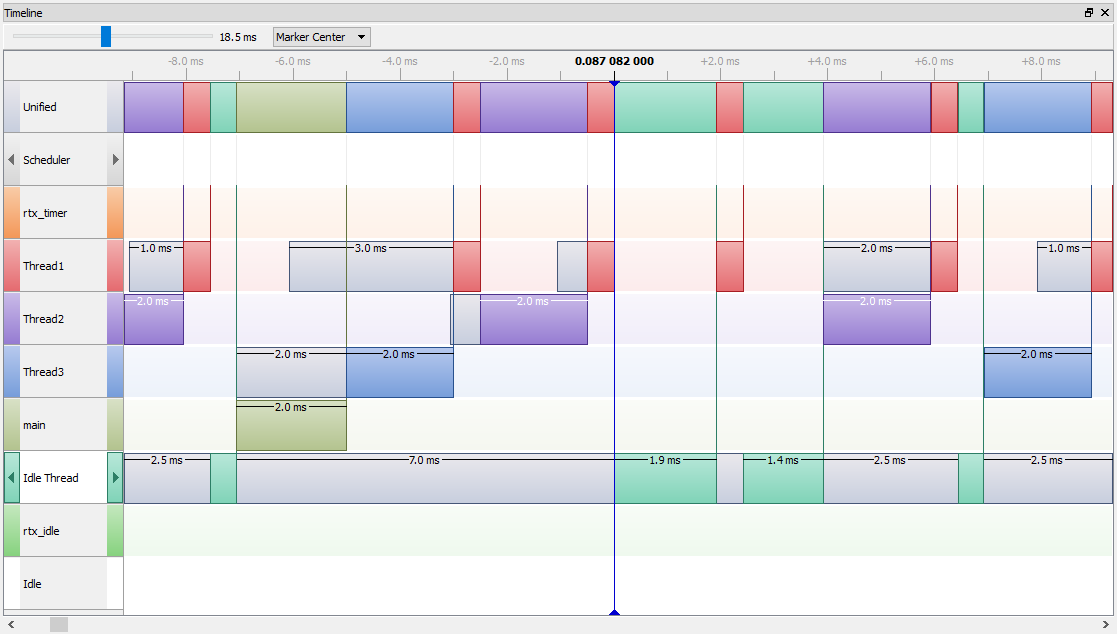
}Note: A somewhat more complete example with several threads can be seen in the examples/ThreeThreads.cpp file in this repository. This example was used to generate the screenshots seen above. A data set recorded from the ThreeThreads example may be downloaded here.
Once you have code that runs MbedSysview flashed to your target, recording events is easy. Just install and start the SystemView application, then launch it and press the play button at the top left to connect to the application. You may need to configure your J-Link settings such as device ID, but besides that it does not need any additional configuration.
Note: Don't be fooled by the dialog box with a bunch of random OS details that pops up when you start the application -- those are not things that you need to configure. In fact, SystemView receives those details from the app itself when it connects.
One of the coolest features of SystemView is markers. Markers allow you to attach custom labels to specific events and time periods in the SystemView trace. Markers are shown on the timeline view along with the threads, and are a great way to add some extra detail to the trace of your application.
Creating markers with MbedSysview is easy. With vanilla SystemView you need to manually assign unique IDs to each marker and register them all from a specific callback, which can be a pain especially when integrating together multiple pieces of code that use them. However, I used the power of C++ constructors to automate this away! Simply constructing a SysviewMarker object will perform all the setup needed to get it to show on the timeline.
To create a marker, all you need to do is instantiate a global SystemView marker object with your name of choice:
#include "SysviewMarkers.h"

SysviewMarker myMarker("My Marker");
Then, when you want to show it on the timeline, you can just call:
myMarker.markStart();To mark the end of a range, you can then call:
myMarker.markEnd();As always, see the docs on this class for more details!
- Implement marker support
- Write Mbed CLI 2 instructions
- Implement a way to name ISRs (future feature!)
- Implement SystemView-over-network support (future feature!)
- Optional Mbed patch to enable recording time spent in the scheduler (future feature!)
This section will explain in more detail how your application starts up and connects to SystemView.
The first significant thing that happens after reset is your code creating the MbedSysview instance and calling the begin() function on it. This initializes the SEGGER RTT buffers and allows the SystemView host application to connect to the processor.
However, events will not actually be recorded yet. For performance reasons, the SystemView library does not log any events until it detects that the SystemView application has actually connected. In production, the application will never connect and there will be very little overhead from SystemView.
At some point, suppose the SystemView application connects. From this point on, SystemView events will be generated by the scheduler instrumentation and put into the RTT buffer, where SystemView reads them and displays them live.
Note that this scheme has one problem: events occurring in your application before SystemView connects will not be recorded. This means that you won't be able to record events that happen at application bootup. To get around this, MbedSysview provides the waitForViewer() function. If you add a call to this function right after calling MbedSysview::begin(), the Mbed application will wait forever until SystemView connects. This is obviously not suitable for production, but should be very useful if you want to capture the boot process during testing.
There is a JLink issue where when the idle thread executes and puts the device into sleep mode, the RTT memory can't be read properly, causing the SystemView output to be corrupted. The only way to avoid this that I've found is to define a thread with an infinite loop that runs at osPriorityLow. The OS will switch to this thread instead of the idle thread when it has no other thread to run, preventing the idle thread from running and breaking things.
SystemView and the standalone SEGGER RTT Viewer program cannot be run at the same time, they will fight each other for control of the RTT stream and cause lost data. If you need to print something out to the host during SystemView operation and you normally use RTT, your only real option is to use the SEGGER_SystemView_PrintfHost() function to print to the SystemView log. However, be aware that this printf implementation has very limited features and essentially only supports integers, not floats or strings.
You should be able to use SEGGER's debugger (J-Link GDB Server) at the same time as SystemView. You will want to connect the debugger and run the application (and make sure it isn't sitting at a breakpoint), then press play in SystemView. Once it connects, you should then be able to stop and debug the application and see SystemView events show up in real time.
Note that I have not tested other 3rd-party debugging tools like OpenOCD, I'm not sure if those will work with SystemView.
Note that I do not believe you can use SEGGER Ozone's debugger at the same time as SystemView, because it will try to read the RTT output and cause data to be lost.
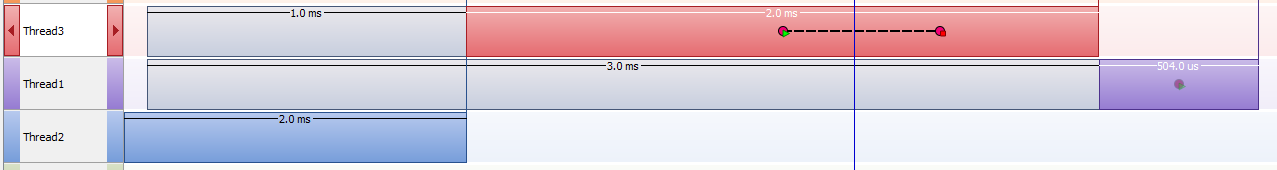
When a thread becomes eligible to be executed and is waiting for the CPU (enters the "ready list" in RTX RTOS terms), this is indicated in SystemView as a grey box in the timeline view.
Unfortunately, the RTX RTOS lacks appropriate callbacks to allow SystemView to show all of the CPU time spent in the RTOS scheduler. You will see some entries to the scheduler in the timeline but it will not show many cases where the scheduler spends time switching threads.