

Inspired by the Andrew Ng's Machine Learning online course, I made my own linear regression plotter in vanilla JavaScript in ECMA6. The library mathjs was added but hasn't been used. Suffice it to say I learned plenty through this project of how JavaScript works and how mathematics works.
If continued, the project will add support especially contour plots, and gradient descent, and ancillarily any dataset scale, n dimensions of data, and selecting dimension shown.
Download and just run.
Defined in these Coursera notes, the mathematical cost function J here:
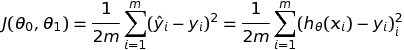
is adapted to the javascript function EvaluateY below:
    /**
     * Evaluate y over all dimensions of x.  e.g. y = x_0 * θ_0 + x_1 * θ_1 + ... + x_n * θ_n
     *
     * @param xs Array of x values
     * @returns {number} Value of y on line at given xs(x_0, x_1, x_2 ... x_n)
     */
    this.EvaluateY = (xs) => {

        let smallerArrayLength = (model.thetas.length < xs.length) ? model.thetas.length : xs.length;

        let y = 0;

        for (let i = 0; i < smallerArrayLength; i++) {
            let x = xs[i];
            let θ = model.thetas[i];
            y += x * θ;
        }

        return y;
    };
Which can begin a detailed conversation of differences applying the math-world to the js-world.