Bars overlaps with default settings in chart with multiple series #1896
Comments
|
Hi @ragazzojp, bar shapes are overlapped, because the corresponding x ticks space aren't enough for bars. If x Axis values scales from 3 to 95, the total width will be calculated based on that scale, where the space designated for the lower values(in the above example, will be the There're 2 possible solution:
|

|
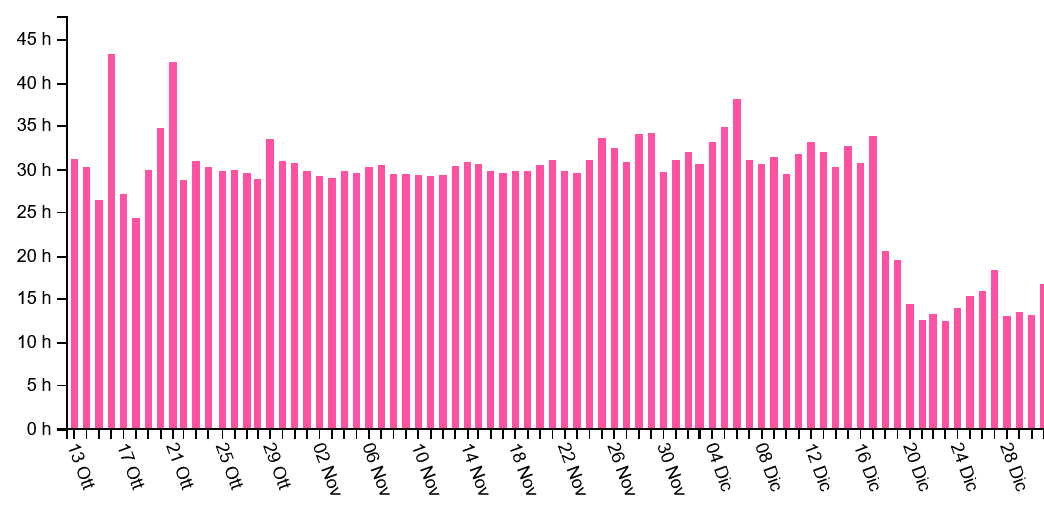
I know It's not a matter of chart width, see for example the following picture, where data is much more dense and it's still rendered nicely with the default settings, but this has only one data serie.
Compare it please with the 2 pictures I posted above, less dense but bars overlap. You can see it live if you prefer. |
|
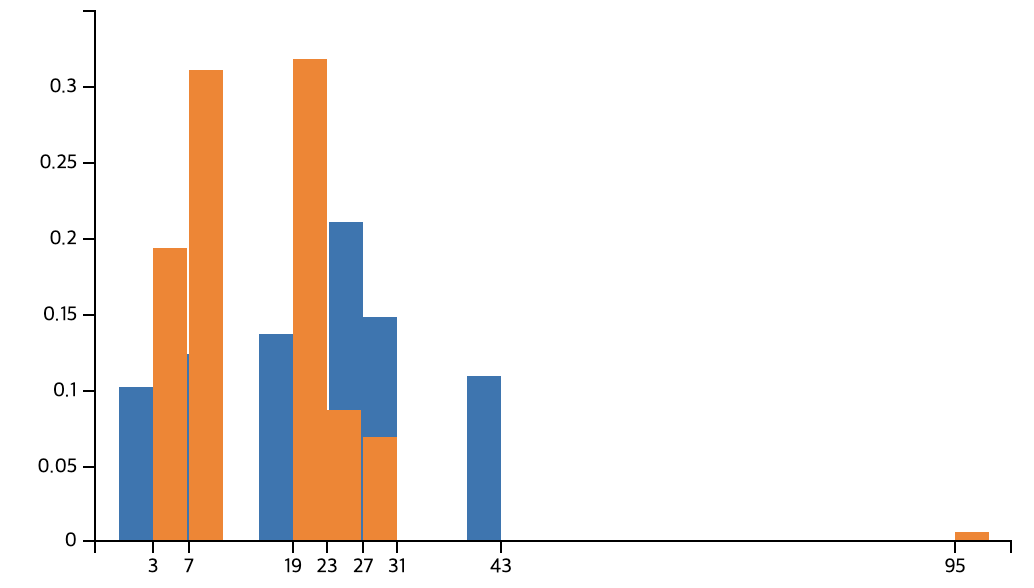
@ragazzojp, after looking the source code I found that the Axis tick's interval aren't calculated correctly. Check out the below screenshot. Same bar width are set, where the right image shows correctly, because every ticks interval are same, whereas the left are getting overlapped.
Fixed versionIt needs to be solved calculating the intervals based on the scale and its ticks value which set to be shown. Based on the new calculation, bar's width will not be overlapped anymore, but as of the default ratio value(
|

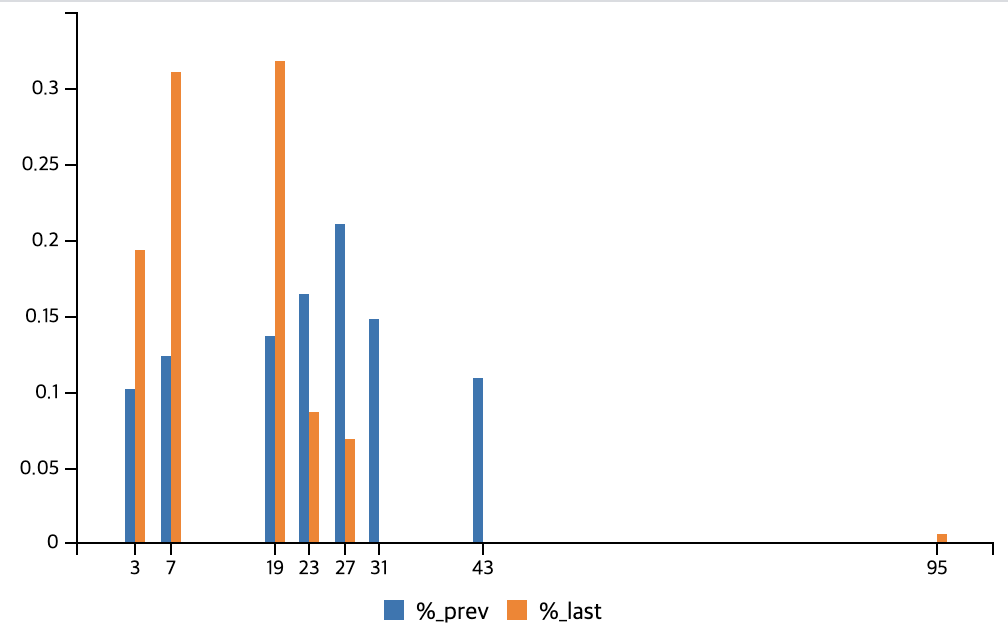
The tick interval calculation should be based on the ticks
position based on the scale, not assuming having every
ticks to be positioned equally.

Ref naver#1896
|
Fix appreciated, I understand the bars looks more narrow now but they're correct and uniform everywhere. This allows me to raise |
# [2.2.0](2.1.4...2.2.0) (2021-01-26)

### Bug Fixes

* **api:** fix incorrect legend text positioning ([f1ede3f](f1ede3f)), closes [#1888](#1888)
* **api:** fix zoom for timesries axis ([0421a50](0421a50)), closes [#1868](#1868)
* **arc:** fix setting color value ([fad9e86](fad9e86)), closes [#1857](#1857) [#1847](#1847)
* **axis:** fix incorrect tick interval calculation ([1a96f3e](1a96f3e)), closes [#1896](#1896)
* **axis:** rotated horizontal xAxisHeight is calculated correctly after loading new data ([ef2754f](ef2754f)), closes [#1786](#1786) [#1787](#1787)
* **bar:** fix bar width on zoom ([25e987a](25e987a)), closes [#1907](#1907)
* **bar:** fix bar width rendering for 'total' data key ([eacaecb](eacaecb)), closes [#1818](#1818)
* **browser:** fix referencing global order ([8f84cb3](8f84cb3)), closes [#1778](#1778)
* **browser:** fix retrieving global ([3474ac0](3474ac0)), closes [#1826](#1826)
* **color:** fix color callback mismatch ([86ef214](86ef214)), closes [#1847](#1847)
* **data:** fix data.order to work for arc types ([3a716a0](3a716a0)), closes [#1863](#1863)
* **eventrect:** fix resizing event rect element after .load() ([12bf547](12bf547)), closes [#1864](#1864)
* **eventRect:** fix data.onclick work for scatter/bubble ([109c87d](109c87d)), closes [#1795](#1795)
* **point:** fix usePoint defs id value ([6df4653](6df4653)), closes [#1887](#1887)
* **radar:** fix data label text position ([c69d674](c69d674)), closes [#1871](#1871)
* **text:** data labels are working in Internet Explorer again ([865224e](865224e)), closes [#1877](#1877)
* **tooltip:** fix arc's tooltip interaction ([a8586a3](a8586a3)), closes [#1859](#1859)
* **types:** fix .load() data type ([7108e7b](7108e7b)), closes [#1848](#1848)

### Features

* **api:** make return values for axis.labels() ([efa5174](efa5174)), closes [#1865](#1865)
* **data:** Intent to ship data.label multiline ([8903aa6](8903aa6)), closes [#1784](#1784)
* **data.labels.colors:** Add callback support ([ac1affa](ac1affa)), closes [#1845](#1845)
* **gauge:** added support for drawing gauge from 'startingAngle' to 'arcLength' ([25954ad](25954ad)), closes [#1633](#1633) [#1803](#1803) [#1849](#1849)
* **gauge:** Intent to ship gauge.background ([632c600](632c600)), closes [#1804](#1804)
* **pie:** Intent to ship pie.outerRadius ([ca67418](ca67418)), closes [#1825](#1825)
* **point:** Intent to ship point.opacity ([fc5ad35](fc5ad35)), closes [#1867](#1867)
Description
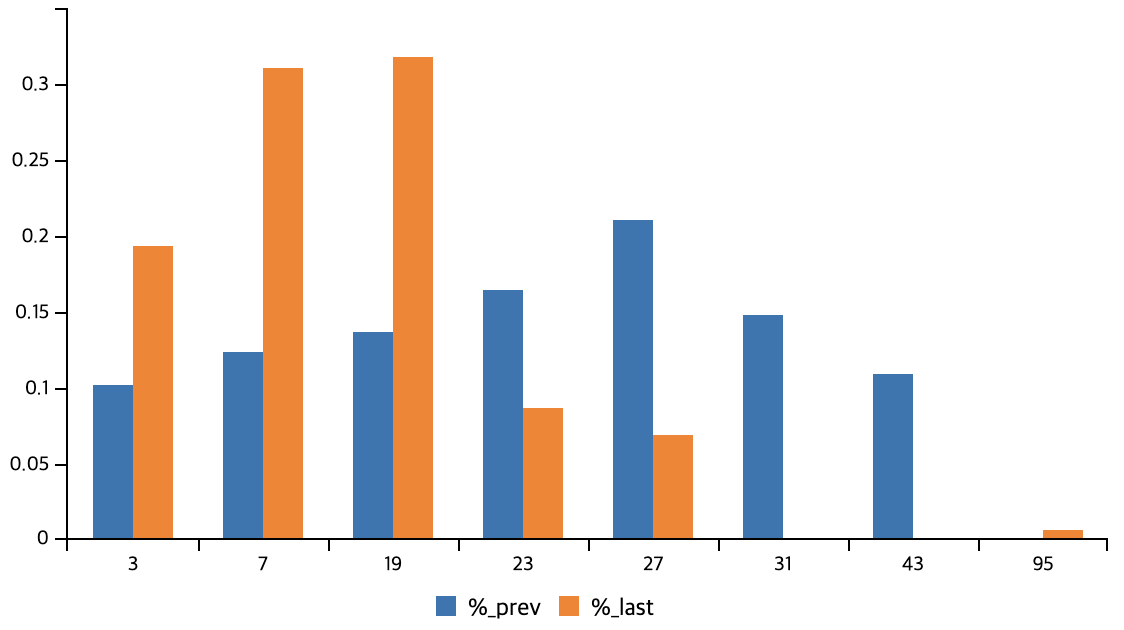
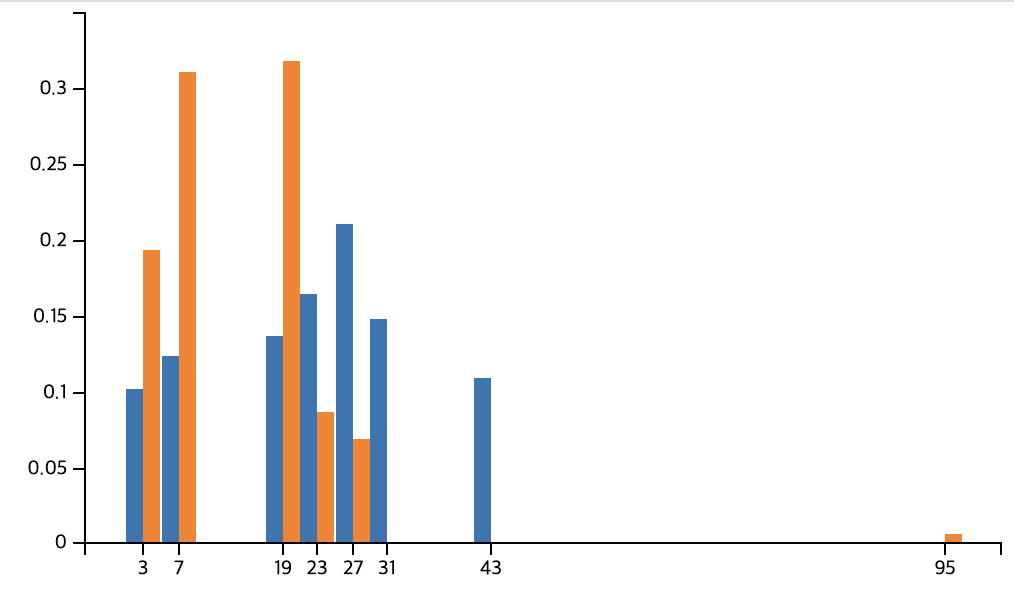
I have a simple bar graph, with two data series. With the default settings, the bars overlaps (see 1st screenshot) when the data point x = 95 is present. I have to configure the bar width and ratio manually to avoid it. Unfortunately the data is dynamic so I can't really do it. If the last row x = 95 is removed, the default settings are just fine (2nd screenshot).
Resizing the graph horizontally, even 2x, doesn't help.
Steps to check or reproduce
Tested with 2.1.4.
The text was updated successfully, but these errors were encountered: