Whitebox is a profiler for the Autofac IoC container.
This project is no longer under development. Check out Autofac.Analysis for an updated alternative.
Building applications with IoC is a joy. We can focus on the immediate requirements of individual components, and the IoC container does the drudge work of assembling the complete application.
While many of us agree that these advantages vastly outweigh the disadvantages, there are very real challenges that we still need to overcome:
- The IoC container is a black box: once the application reaches non-trivial complexity, understanding exactly what is going on in there can be a challenge.
- Starting to work on an application that uses IoC from another developer or team can be a daunting task, as there is often no thread to follow in order to work out how the application does much of what it does.
Whitebox eliminates these obstacles to productivity.
- It shows you exactly what is going on in the container, in real-time, as the application runs.
- It helps identify common traps and problematic usage patterns, along with suggestions for correcting them.
There are two ‘obvious’ approaches to exploratory tooling for IoC.
Static analysis is the first and most academically pleasing way to get information about a composition. This is the approach taken by MEFX.exe and Visual MEFX.
The greatest benefit of static analysis is that its results are available at build time, so information about a composition can be gained, for example, in an IDE-based browser, or a continuous integration server.
The limitation of a static analysis approach is that unless very strict rules are followed both in how the IoC container and the client application are constructed, the picture of “reality” may be different at build time vs. runtime. Modern IoC containers are very dynamic, and applications themselves are highly configurable, so static analysis turns out to be a poor choice for most users today.
Dynamic analysis or just plain old ‘Tracing’ is the second approach to understanding what is going on in an IoC container. The goal of tracing is to present an accurate picture of exactly what occurs during program execution. When compared with other development tools already in use, the group that most accurately reflects this aim are generally called profilers.
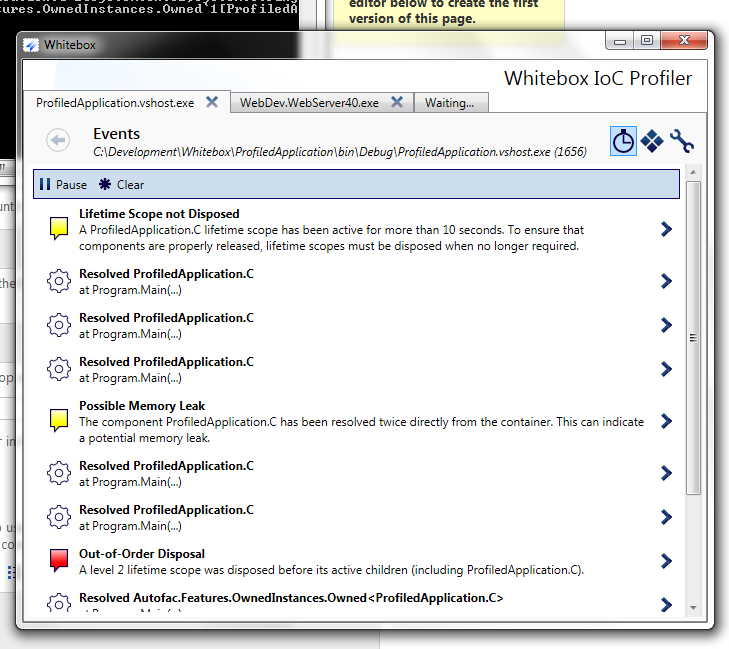
Whitebox doesn’t show you a raw stream of trace events. Instead, it reconstructs the higher-level operations and implied dependency structure in an integrated view.
Each of the ‘resolve operation’ events is a single call to the container’s Resolve() method (or an equivalent.) The event shows where the operation occurred, but more importantly, clicking on the event will show how the resultant object graph was built.