Ideas for improve loading times #38
Comments
|
Thank you! I'm away at the minute but will test this on a new version once I'm back 👍🏼👍🏼👍🏼 |
|
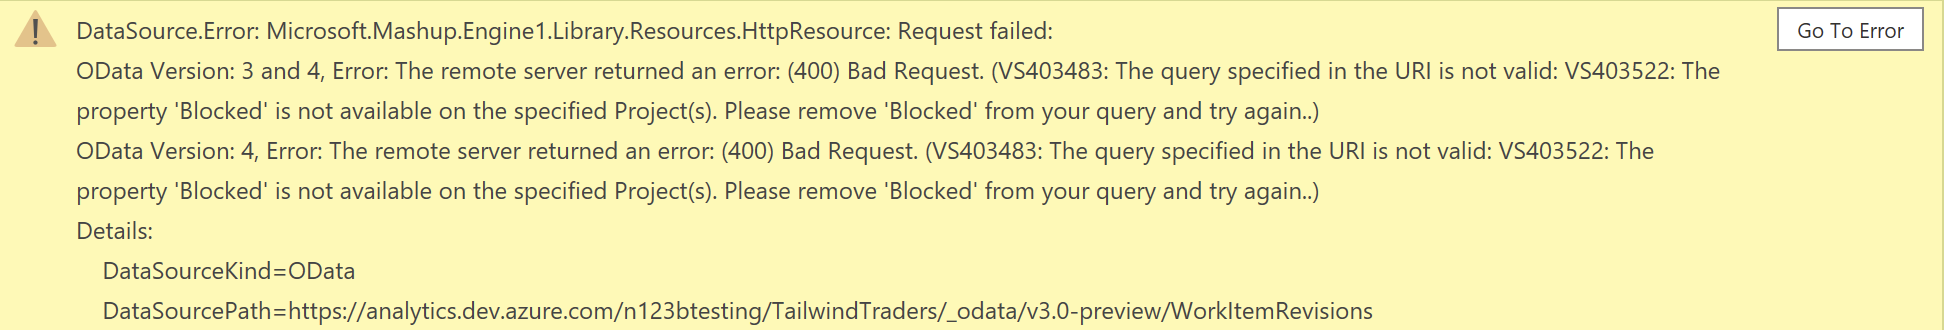
Hi there - I just started playing around with this and also remembered why I designed it the way I did :) 'Blocked' is not available in any projects with an 'Agile' process template - so it actually throws an error using the query you suggest:
So I don't think this suggestion will work... |
|
Closing as suggestion would mean solution would be incompatible with users on the 'Agile' process template |
|
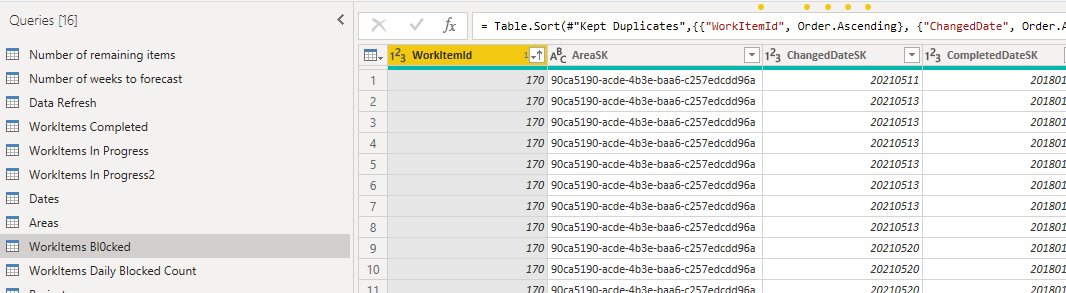
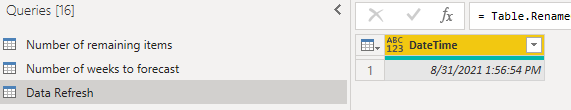
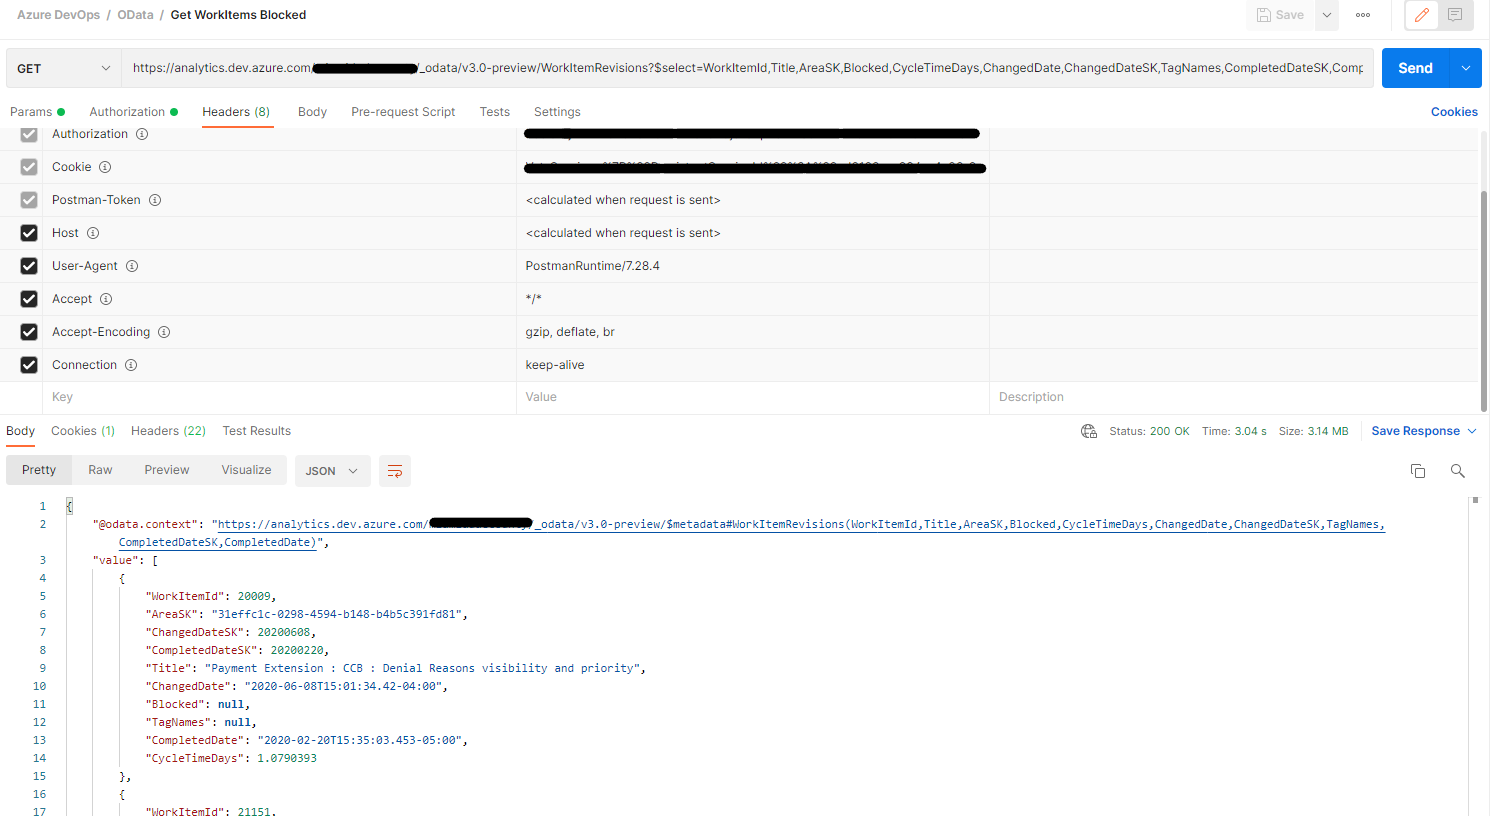
That's interesting. I'm using a custom process derived from agile. I've added no "Blocked" property to it and yet, it works for me. This is my full query Here's a screenshot of it refreshing Here's the refresh stamp No issues at all and I have my data This is the exact same query running from Postman, note the results are coming through without error I also have no project in my organization using CMMI Any ideas on what else might be different? |

|
Let me have a look and get back to you (reopening) |
|
Ah ok - looks like I've got it working now 👍 |
|
Fixed in the latest version - thank you again :) |
Problem
The slowest loading tables seem to be "WorkItems Bl0cked" and "WorkItems Daily Bl0cked Count". I believe this is related to the sheer amount of data that has to be acted on when transformations are done directly to the WorkItemRevisions endpoint. Specifically this is happening due to the "Removed Columns" action right after the OData feed. This action is just selecting the only 6 columns needed in both tables because the WorkItemRevisions endpoint returns a lot of more columns (aka more data). This is not needed since the endpoint accepts a column selection parameter.
Solution
In both tables instead of querying the endpoint with a filter, do it with a select and a filter and then remove the subsequent Removed Columns (select columns) action.
Instead of:
Do:
This removes the need for a subsequent select action in the BI side.
I've tested this approach and it cuts loading time for those tables in about 75%
The text was updated successfully, but these errors were encountered: