This project creates some extra charts and tables from your todoist data mainly around using the age of a tasks.
A version of this project has been deployed on Heroku using a free plan (So no guarantees that it will be up). App on Heroku. If it has been incative for a while it will be slow to load.
- To use this project you need to run the graphql server as well todoist-graphql project.
- Run -
npm install - Run -
npm start - Open http://localhost:8080
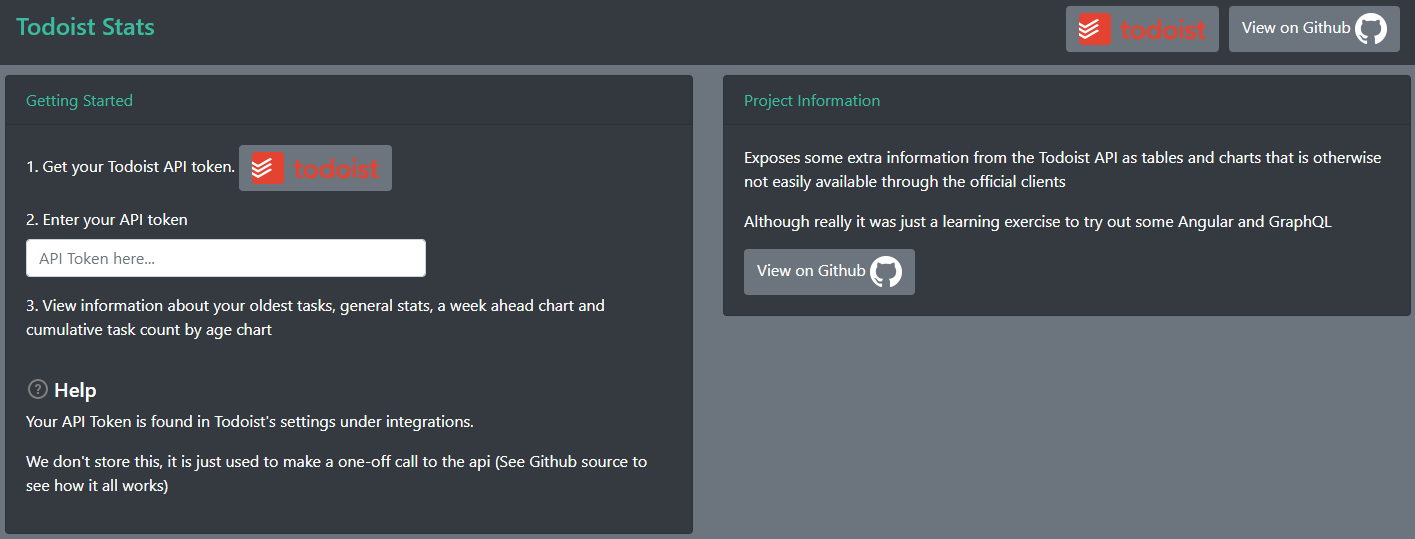
- Get your todoist api key (Clicking the button on screen takes you to the settings page where the key is located).
- Put it in the box, this then makes one call off to the todoist api (via the GraphQL server) to retrieve the tasks. It isn't stored anywhere, if you come back to the site later you will have to enter it again.
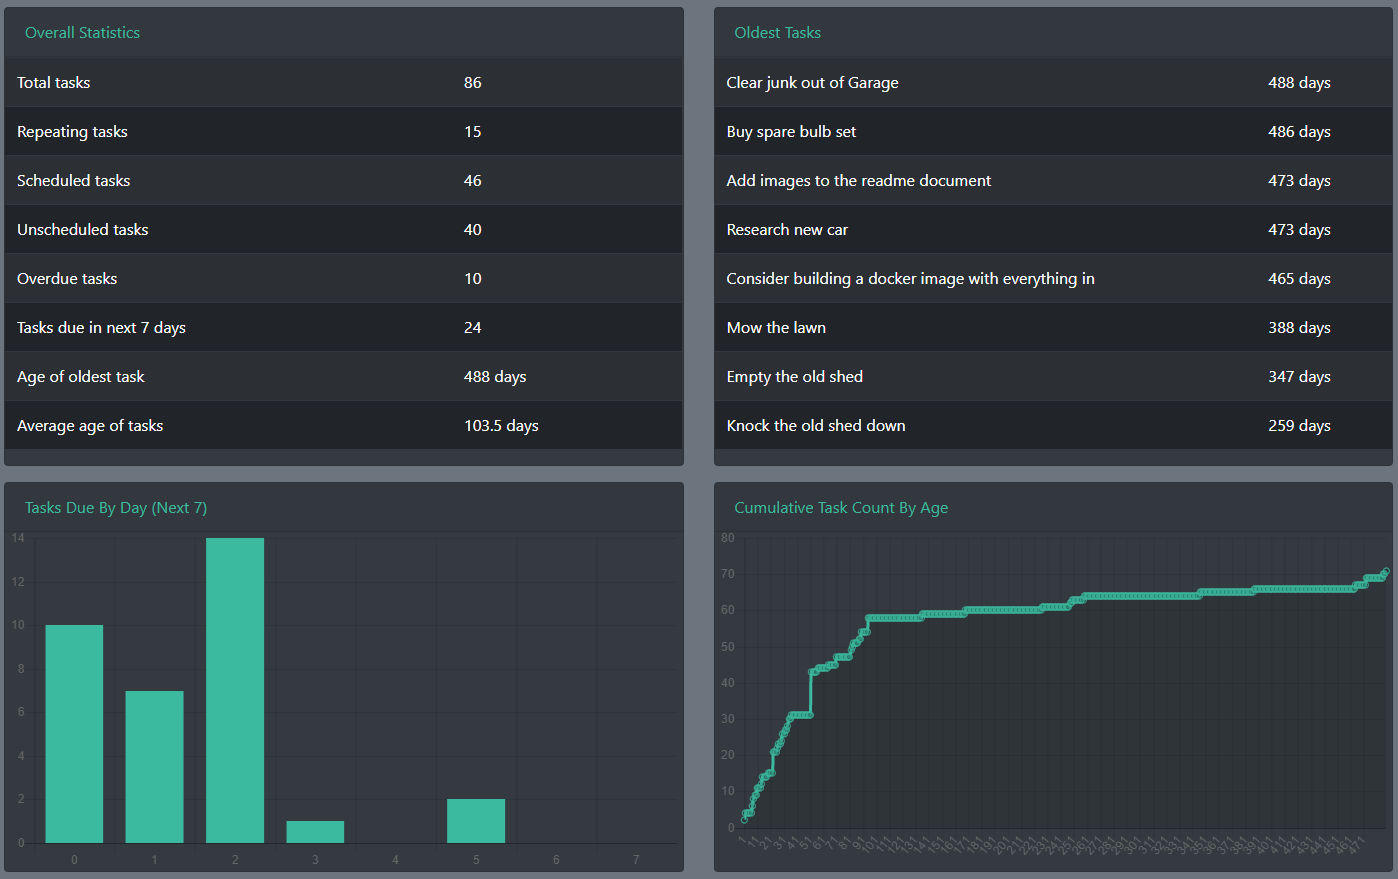
- Overall Statistics - General stats based on task counts and ages of tasks
- Oldest Tasks - Your oldest tasks which aren't scheduled as repeating tasks
- Tasks Due By Day (Next 7) - Shows the number of tasks per day that are coming up over the next 7 days. Day 0 is all overdue tasks.
- Cumulative Task Count By Age - Shows the number of active tasks added by age. Taking the chart in the screenshot as an example it highlights that most of my tasks were added in the last 90 days. Any tasks that don't get completed in 90 days tend to sit on my task list forever!
Ideas welcome! You can submit some ideas on the issues page here.