Installation
Note: This has only been tested with Grafana 4.4.1 and I cannot guarantee it will work with older versions.
You will need to configure PRTG to add an Access-Control-Allow-Origin HTTP header. This can be done in two simple steps:
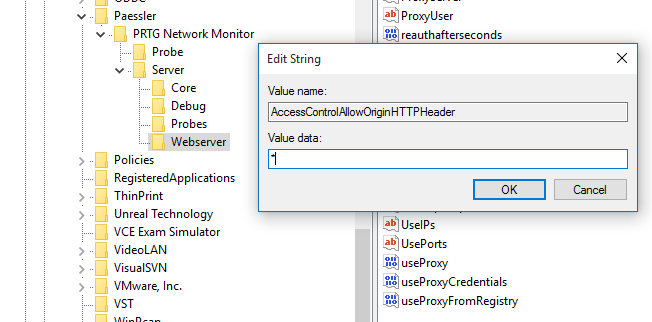
Step -1: Add a String value named "AccessControlAllowOriginHTTPHeader" to the registry key HKLM\Software\Wow6432Node\Paessler\PRTG Network Monitor\Server\Webserver.
Step 0: Restart the PRTG Core Server service.
Step 1: Download the current release from the master branch.
Step 2: Copy/move the jasonlashua-prtg-datasource directory into your Grafana data/plugins directory.
Step 3: Restart the Grafana server.
Step 4: Select the Datasource page and click the "Add new" button.
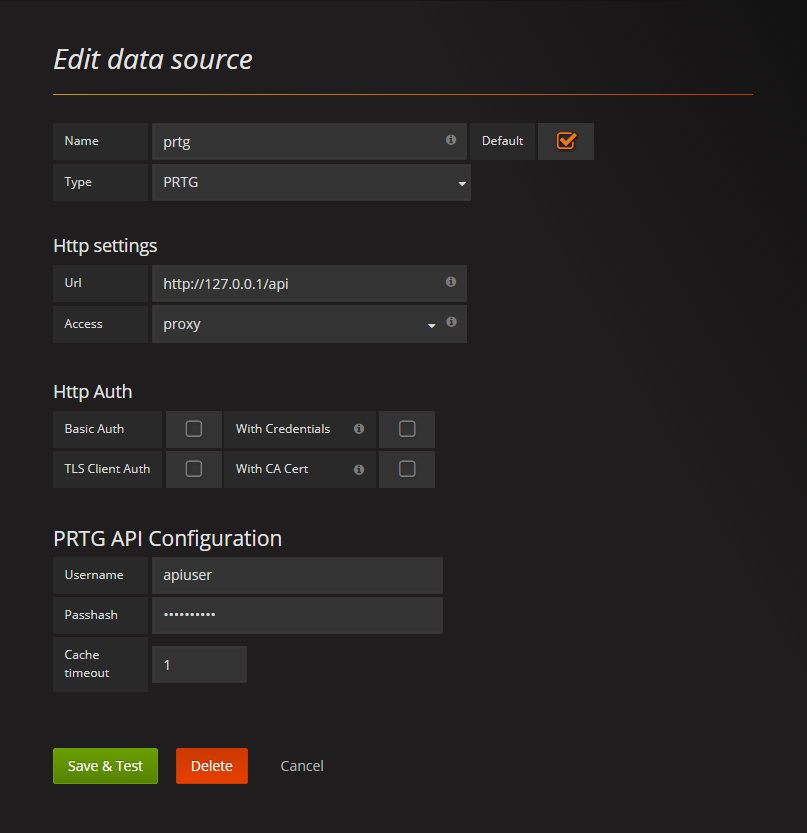
Step 5: Under Edit Data Source, Choose a simple name, e.g., "PRTG" and select "prtg" as the data source type.
Step 5(b): Under HTTP Settings, provide the API URL. Typically you should chose "proxy" as the access mode unless you specifically want the web browser to directly communicate with PRTG.
Note: The PRTG API is usually the url of the PRTG server with "/api" appended, e.g. http://myprtg.domain.com/api
Step 5(c): Skip the Http Auth section.
Step 5(d): Under PRTG API Configuration, provide the username for the account you will be accessing the API as. For the passhash, you will find this in the PRTG account page for that user. Providing the password will not work. This is barely more secure than nothing - insofar that it is at least a deterrent to the typical unmotivated user.
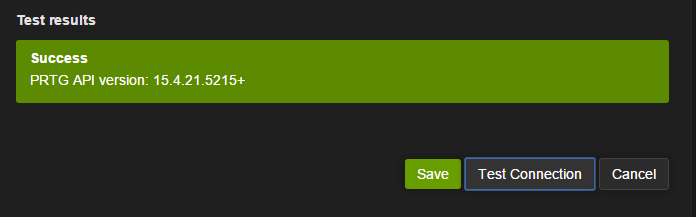
Step 6: Click the "Test Connection" button to verify your datasource connection.
Step 7: Go make dashboards!