Home
| Name | Layout Graph2D | Version |
|---|---|---|
| Updated by | Mathias PFAUWADEL | 1.3 |
- 1.3 : You can choose color on a group
- 1.2 : Adding Naming and possibilities to manually group
- 1.1 : Adding minimalist behaviour
- 1.0 : 1st version working
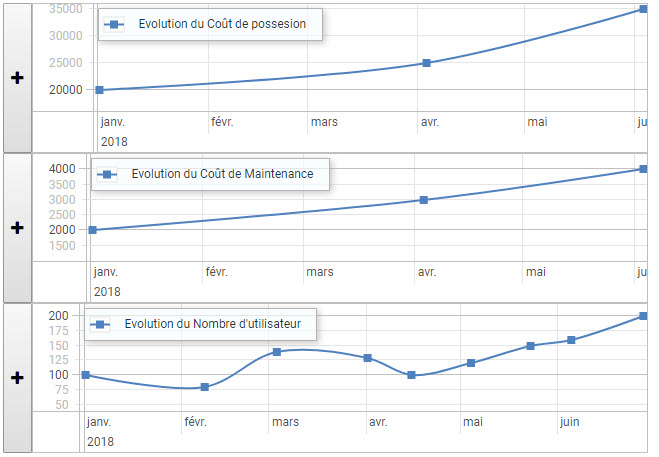
Allow you to display a 2D graph base on an object and his associated mesurement
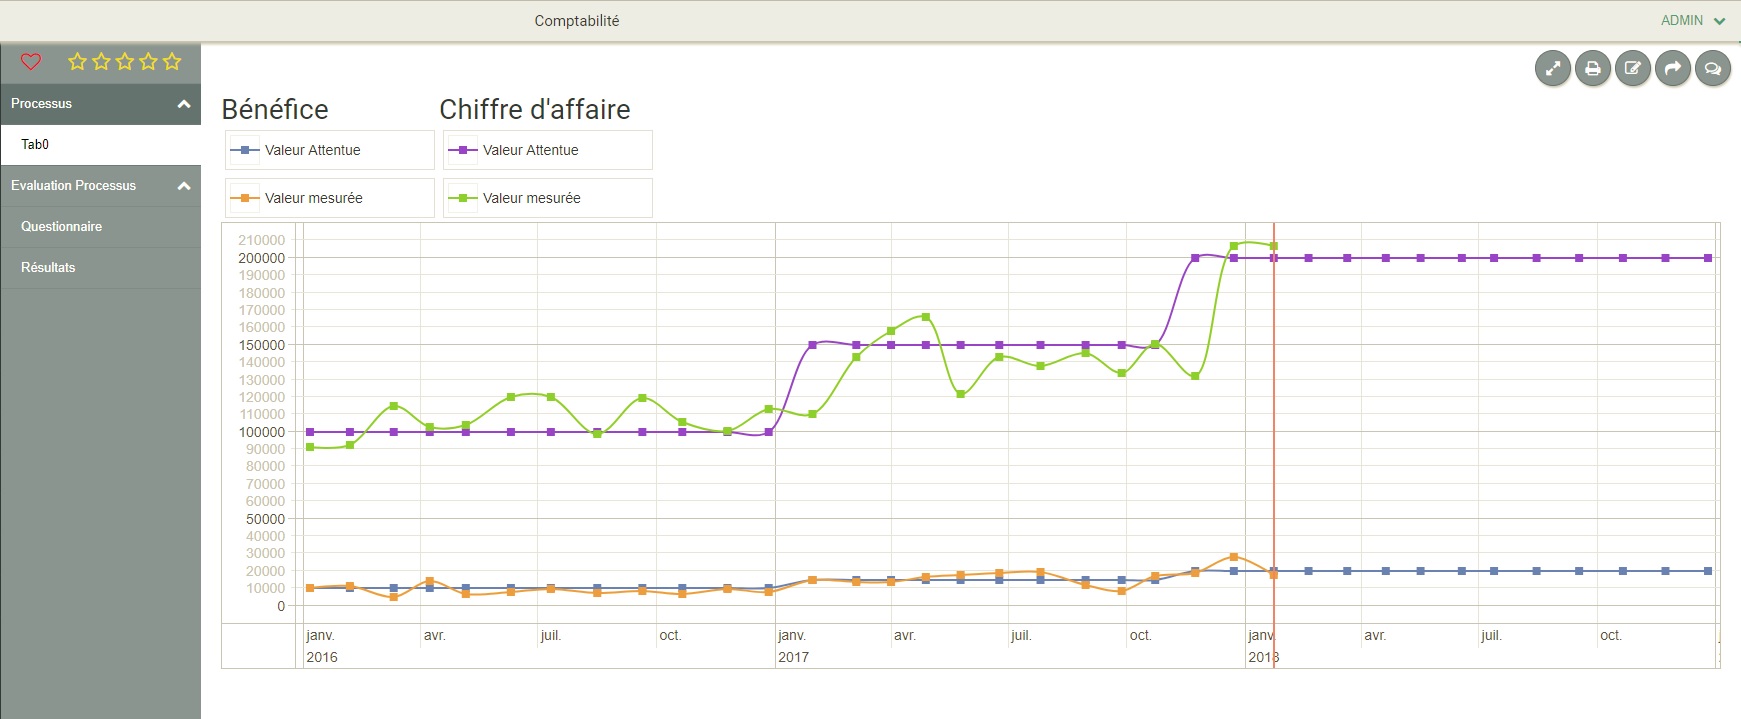 You can click on the different curve to display or not a curve
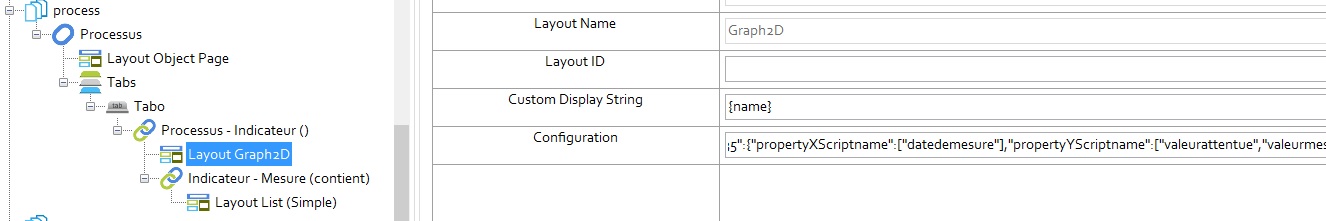
Describe your step in a json file, then mimify it on https://www.cleancss.com/json-minify/ Here is an exemple :
{
    "disable0": true, // if true will not display the dot with a value of 0
    "isMinimalist": true, // if true, the graph will be minimal
    "complementaryNode" : ["nodeID1","nodeID2"] // allow to add node that are not below your layout
    "mesurementNodes": {
        "mesure_20115_1779468335": { //nodeID
            "parentName" : "Mesure", // optionnal
            "name" : "valeur",// optionnal
            "color" : "hexColor", // color in hexadecimal (optionnal)
            "propertyXScriptname": ["datedemesure"], //propertyScripName in lowercase
            "propertyYScriptname": ["valeurattentue", "valeurmesurée"] //propertyScripName in lowercase
        }
    }
}
If this option is turn on, the graph will be smaller (work only with one Y property), you can click to expend the graph