Home
| Name | Gantt | Version |
|---|---|---|
| Updated by | Mathias PFAUWADEL | 1.0 |
- 1.0 : 1st version working
- More Options
- Add Translations i18n like Data/Common/i18n
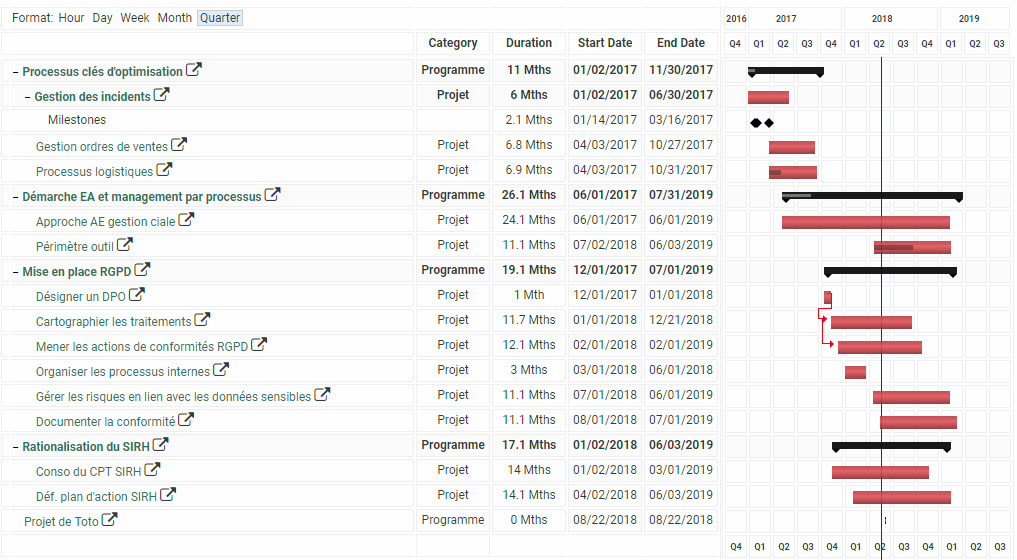
Allow you to display objects in a gantt Chart with Milestones and dependency
The layout will scan all of your hierarchy tree, and put it in a Gantt Chart
You can use the Custom Display String Enhanced specific to have the PopOut icon
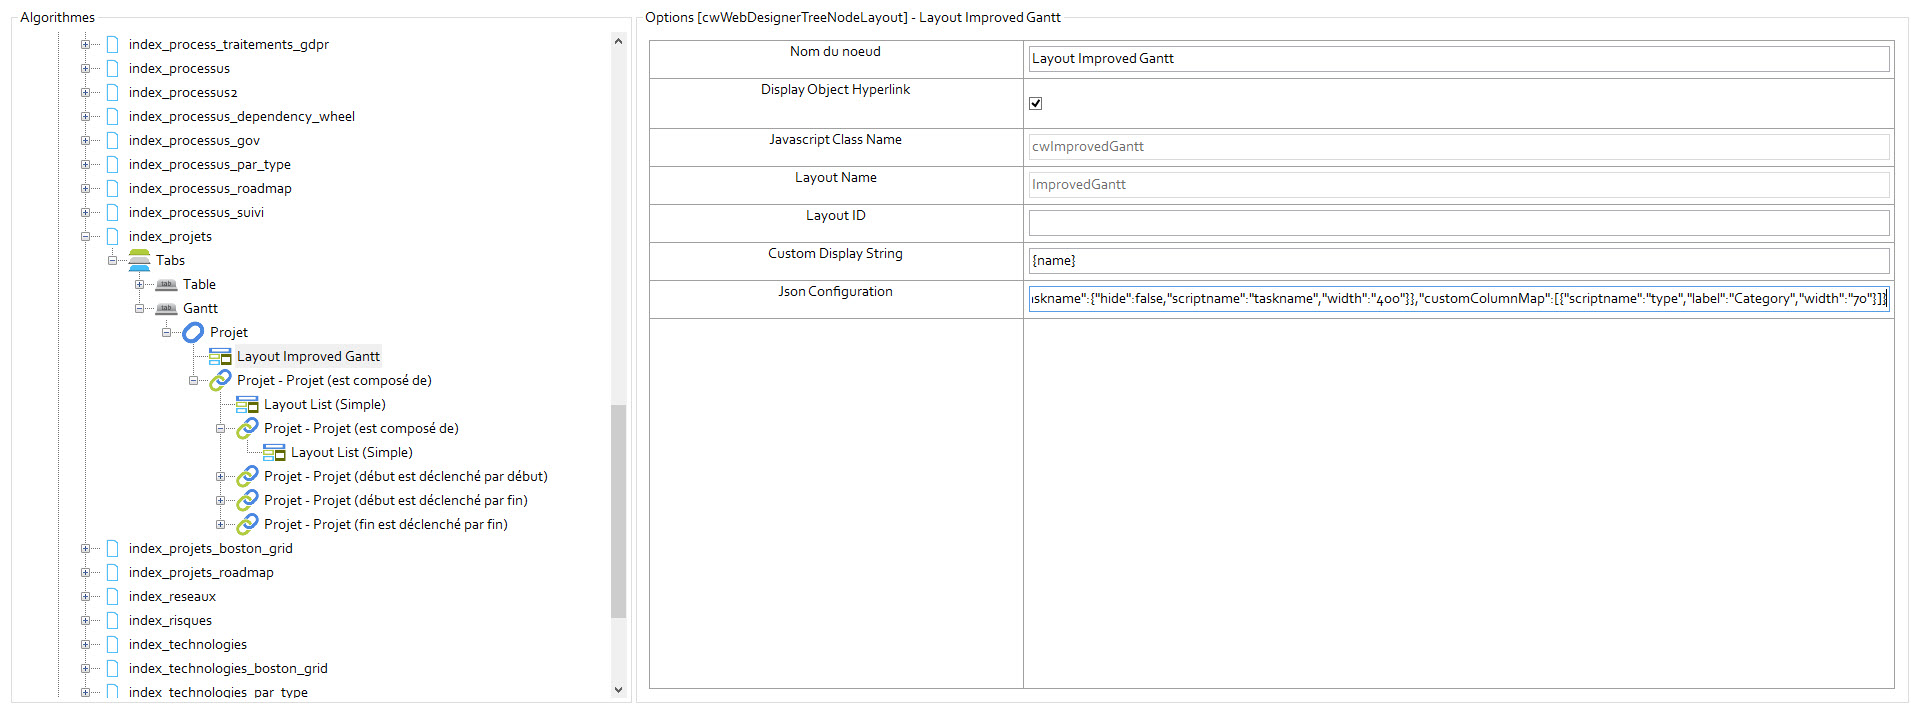
Describe your configuration in a json object, then mimify it on https://www.cleancss.com/json-minify/
Here is an exemple of a json configuration.
{
    "nodes": [{
        "nodeID": "projet_474185792",
        "startDate": "STARTDATE",
        "endDate": "ENDDATE",
        "completion": "PERCENTCOMPLETE",
        "finishToStart": [],
        "startToStart": [],
        "finishToFinish": [],
        "milestone" : [],
        "classStyle": "ggroupblack"
    }, {
        "nodeID": "projet_20027_205402790",
        "startDate": "STARTDATE",
        "endDate": "ENDDATE",
        "completion": "PERCENTCOMPLETE",
        "finishToStart": ["projet_20217_39247427"],
        "startToStart": ["projet_20218_858571321"],
        "finishToFinish": ["projet_20219_1725533778"],
        "milestone" : ["projet_20027_2109559671"],
        "classStyle": "gtaskred"
    }],
    "hiddenNodes": [""],
    "complementaryNode": [],
    "dateDisplayFormat": "mm/dd/yyyy",
    "scale": "month",
    "fixedColumnMap": {
        "startdate": {
            "hide":false,
            "scriptname": "startdate",
            "width": "70"
        },
        "enddate": {
            "hide":false,
            "scriptname": "enddate",
            "width": "70"
        },
        "duration": {
            "hide":false,
            "scriptname": "duration",
            "width": "70"
        },
        "pccomplete": {
            "hide":true,
            "scriptname": "pccomplete",
            "width": "50"
        },
        "taskname": {
            "hide":false,
            "scriptname": "taskname",
            "width": "400"
        }
    },
    "customColumnMap": [{
        "scriptname": "type",
        "label": "Category",
        "width": "70"
    }]
}
You can create your json easily by going on this site
List here all the node that will be use in the gantt chart. Structure of the object
"nodeID": "projet_20027_205402790",              // node ID in evolve
"startDate": "STARTDATE",                        // Scriptname of the property containing the startDate
"endDate": "ENDDATE",                            // Scriptname of the property containing the endDate
"completion": "PERCENTCOMPLETE",                 // Scriptname of the property containing the completion pourcentage
"finishToStart": ["projet_20217_39247427"],      // The start of the task of this node will be trigger by the end of the tasks in these association Node
"startToStart": ["projet_20218_858571321"],      // The start of the task of this node will be trigger by the start of the tasks in these association Node
"finishToFinish": ["projet_20219_1725533778"],   // The end of the task of this node will be trigger by the end of the tasks in these association Node
"milestone" : ["projet_20027_2109559671"],       // The task of this node will has as milestone the child object in these association Node
"classStyle": "gtaskred"                         // Choose the style of your task, ggroupblack, gtaskblue, gtaskred, gtaskgreen, gtaskyellow, gtaskpurple, gtaskpink
Hidden Nodes
Set the ID of the nodes you don't want to appear in the gantt, the children will be display instead.
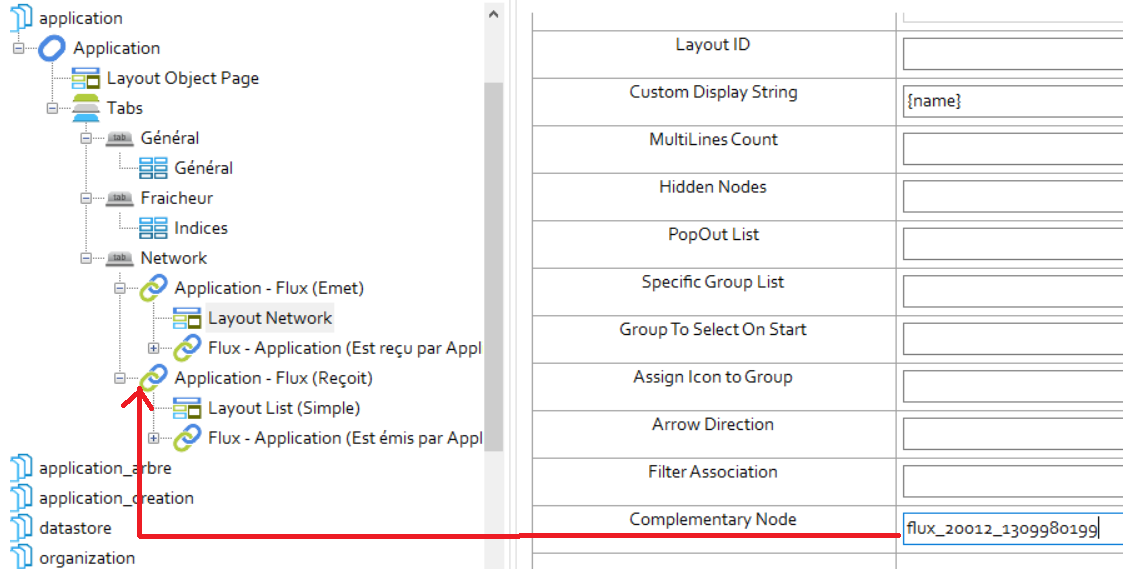
If you want to add a side Node, use this option.
Select the format of display of your dates :
h: Hour (1-12)
hh: Hour (01-12)
pm: am/pm indicator
PM: AM/PM indicator
H: Hour (0-23)
HH: Hour (01-23)
mi: Minutes (1-59)
MI: Minutes (01-59)
d: Day (1-31)
dd: Day (01-31)
day: Abbreviated day of week
DAY: Day of week
m: Month (1-12)
mm: Month (01-12)
mon: Abbreviated month text
month: Full month text
yy: Year, excluding century
yyyy: Year
q: Quarter (1-4)
qq: Quarter (Q1-Q4)
w: ISO Week number (1-53)
ww: ISO Week number (01-53)
week: Full ISO Week date format
separated by one of the following characters: "/-.,':
Default scale when you arrived on the gantt, can be changed via buttons : "day","week","month","quarter"
Set the option for the different default column of the gantt chart, you can choose the width or if it's hidden or not
don't modify the scriptname
{
    "startdate": {
        "hide":false,
        "scriptname": "startdate",
        "width": "70"
    },
    "enddate": {
        "hide":false,
        "scriptname": "enddate",
        "width": "70"
    },
    "duration": {
        "hide":false,
        "scriptname": "duration",
        "width": "70"
    },
    "pccomplete": {
        "hide":true,
        "scriptname": "pccomplete",
        "width": "50"
    },
    "taskname": {
        "hide":false,
        "scriptname": "taskname",
        "width": "400"
    }
}
You can add a property to be display in the column. Choose the width, the label and the casewise scriptname
"customColumnMap": [{
    "scriptname": "type",
    "label": "Category",
    "width": "70"
}]