


NFN Design & Partnership Docker Tools, adopted from laradock.
Docker container includes:
- consul
- adminer
- grafana
- mariadb
- mongodb
- mysql
- percona
- pgadmin
- phpmyadmin
- portainer
- postgresql
- prometheus
- redis
Default all configuration:
username: nfndppassword: password
- Prometheus (metrics database)
http://<host-ip>:9090 - Prometheus-Pushgateway (push acceptor for ephemeral and batch jobs)
http://<host-ip>:9091 - AlertManager (alerts management)
http://<host-ip>:9093 - Grafana (visualize metrics)
http://<host-ip>:3000 - NodeExporter (host metrics collector)
- cAdvisor (containers metrics collector)
- Caddy (reverse proxy and basic auth provider for prometheus and alertmanager)
Prometheus Architecture
Docker Host Dashboard
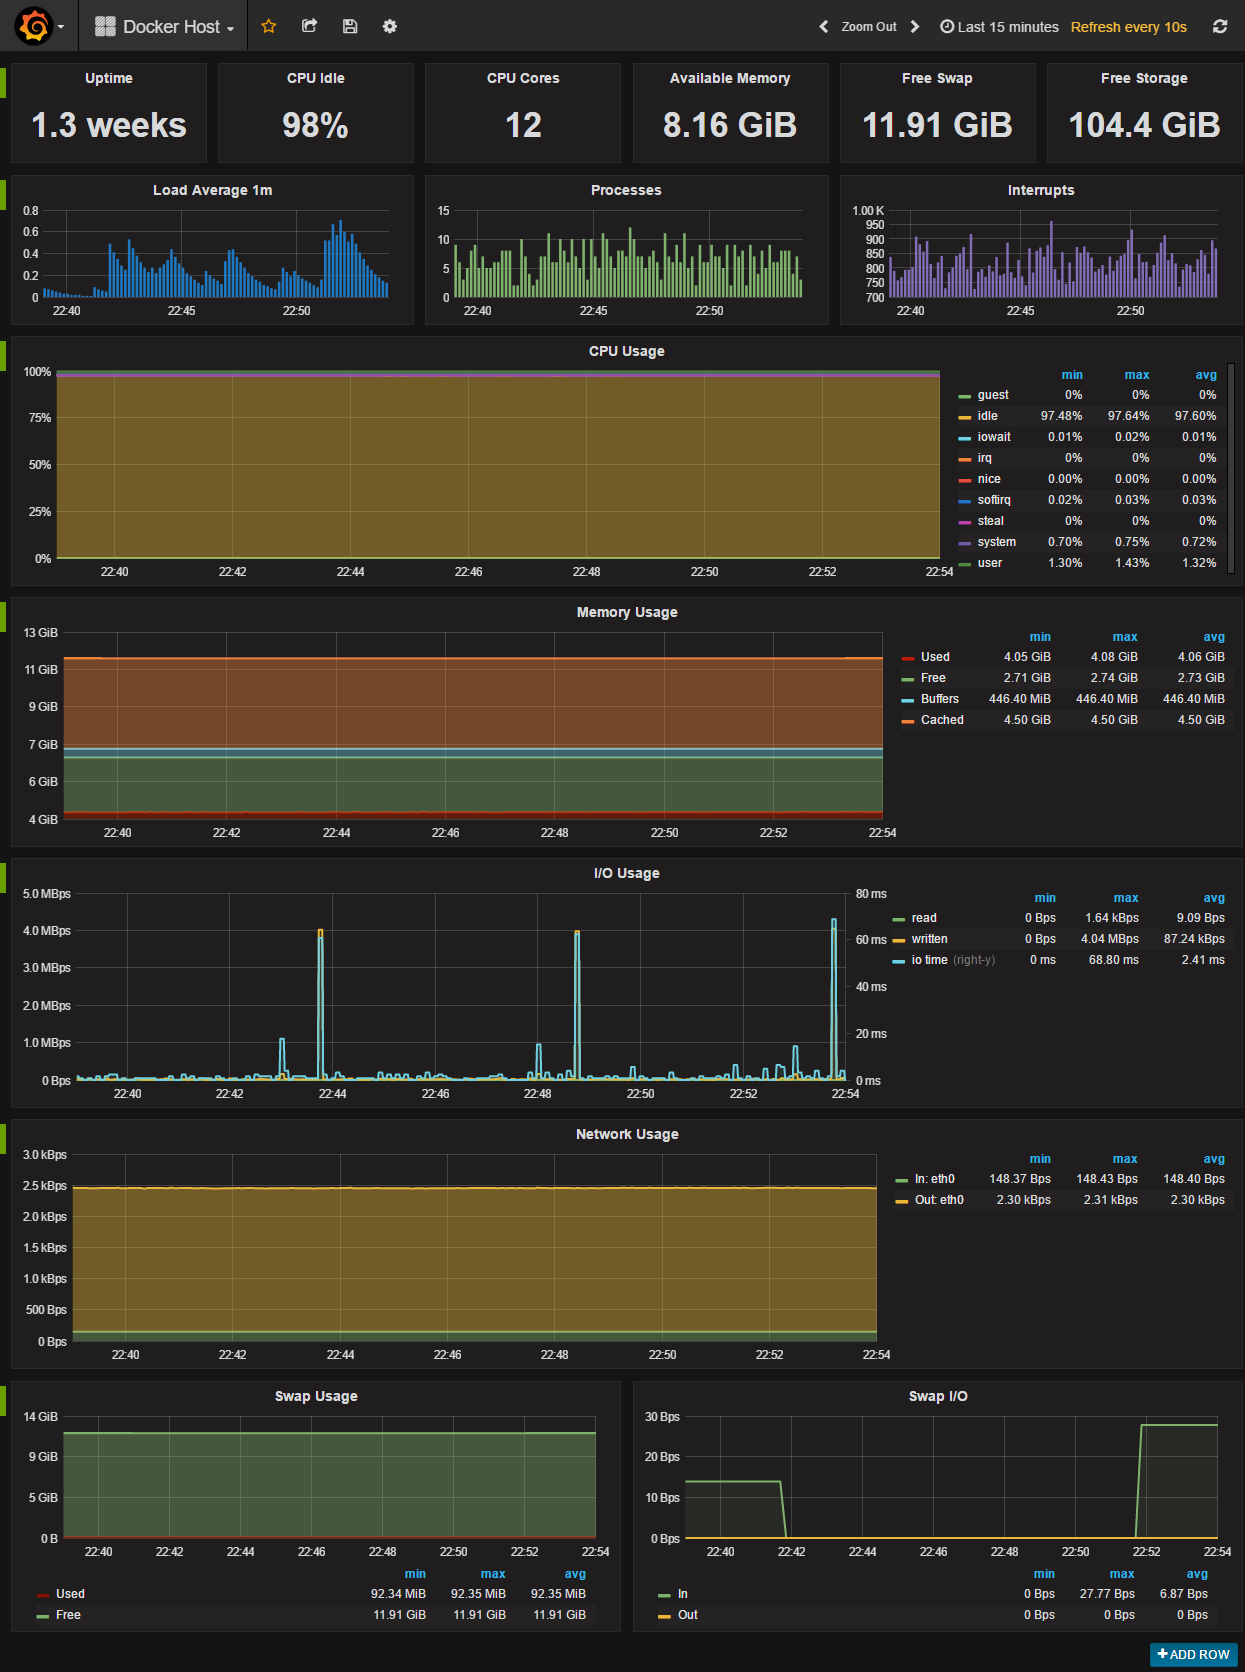
The Docker Host Dashboard shows key metrics for monitoring the resource usage of your server:
- Server uptime, CPU idle percent, number of CPU cores, available memory, swap and storage
- System load average graph, running and blocked by IO processes graph, interrupts graph
- CPU usage graph by mode (guest, idle, iowait, irq, nice, softirq, steal, system, user)
- Memory usage graph by distribution (used, free, buffers, cached)
- IO usage graph (read Bps, read Bps and IO time)
- Network usage graph by device (inbound Bps, Outbound Bps)
- Swap usage and activity graphs
Docker Containers Dashboard
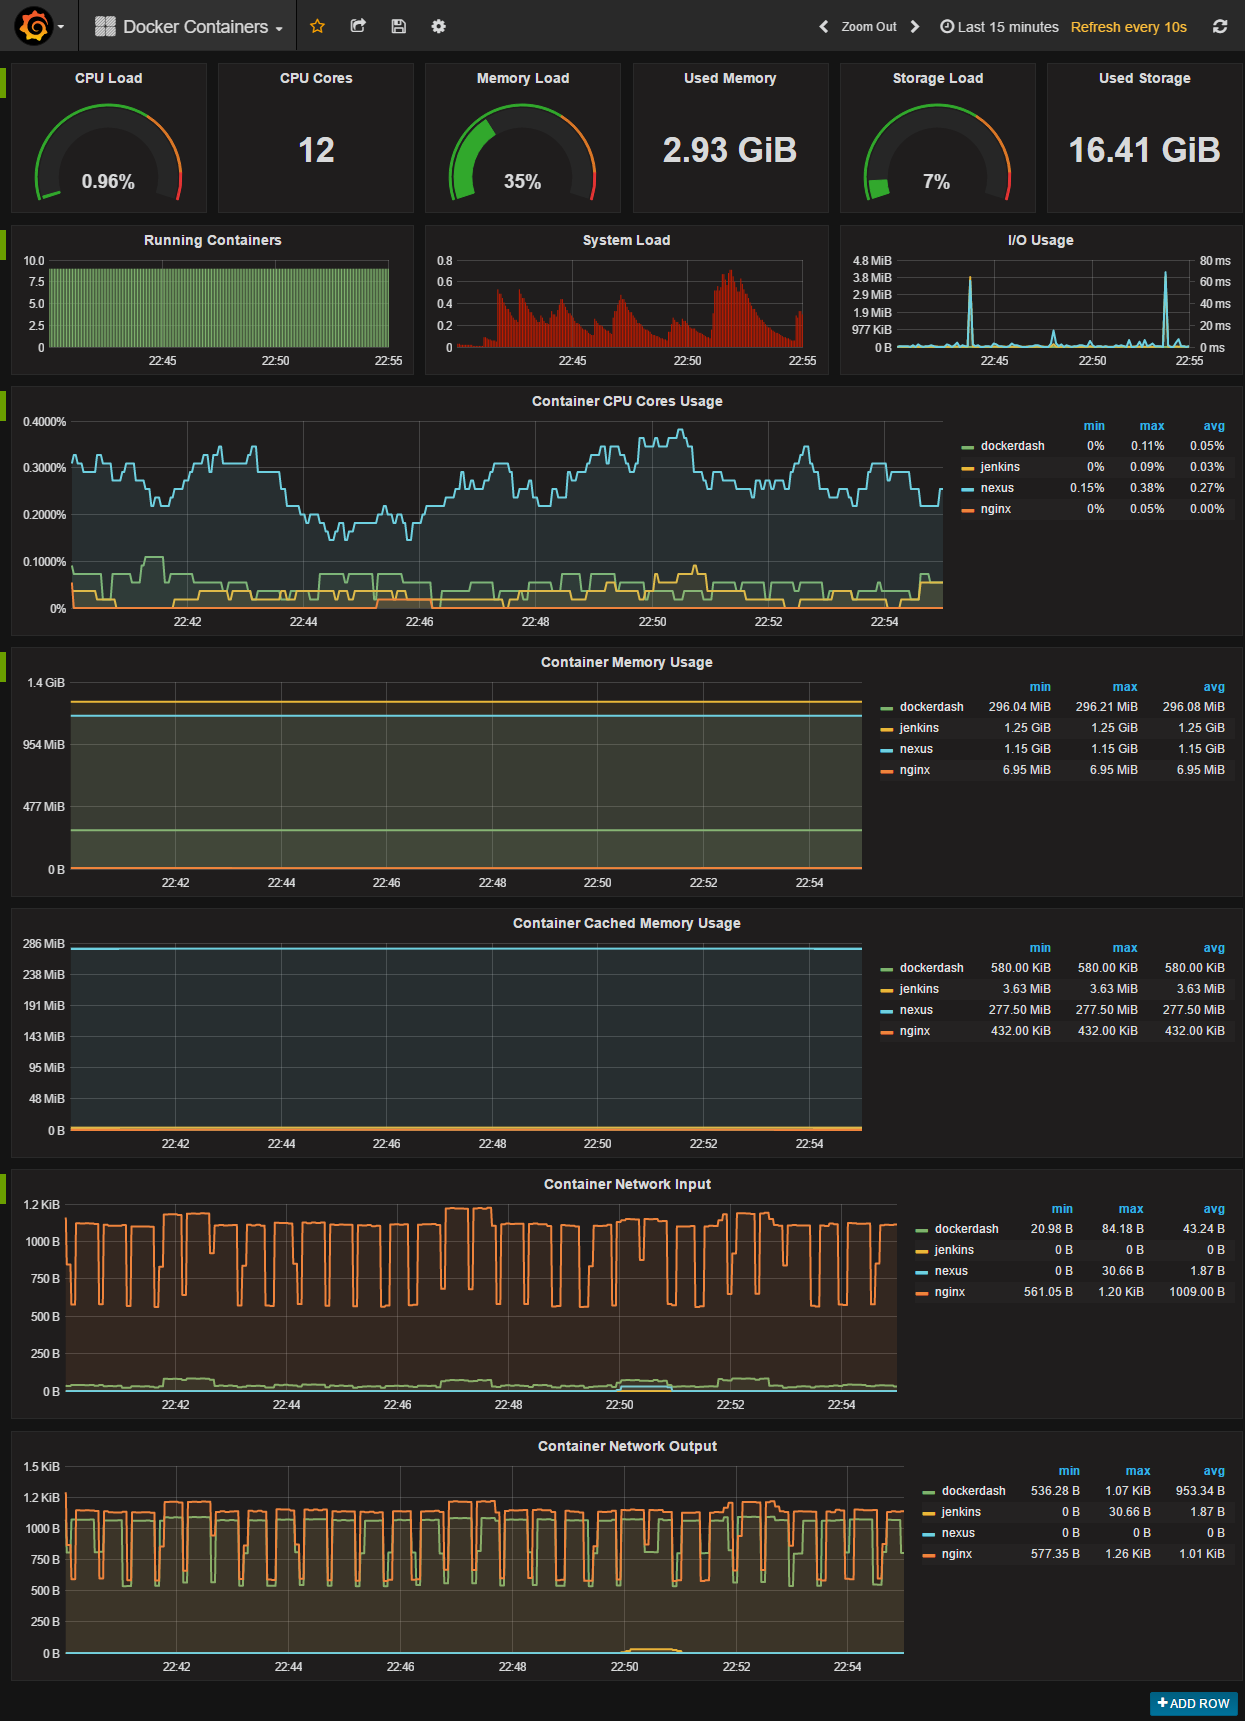
The Docker Containers Dashboard shows key metrics for monitoring running containers:
- Total containers CPU load, memory and storage usage
- Running containers graph, system load graph, IO usage graph
- Container CPU usage graph
- Container memory usage graph
- Container cached memory usage graph
- Container network inbound usage graph
- Container network outbound usage graph
Note that this dashboard doesn't show the containers that are part of the monitoring stack.
Monitor Services Dashboard
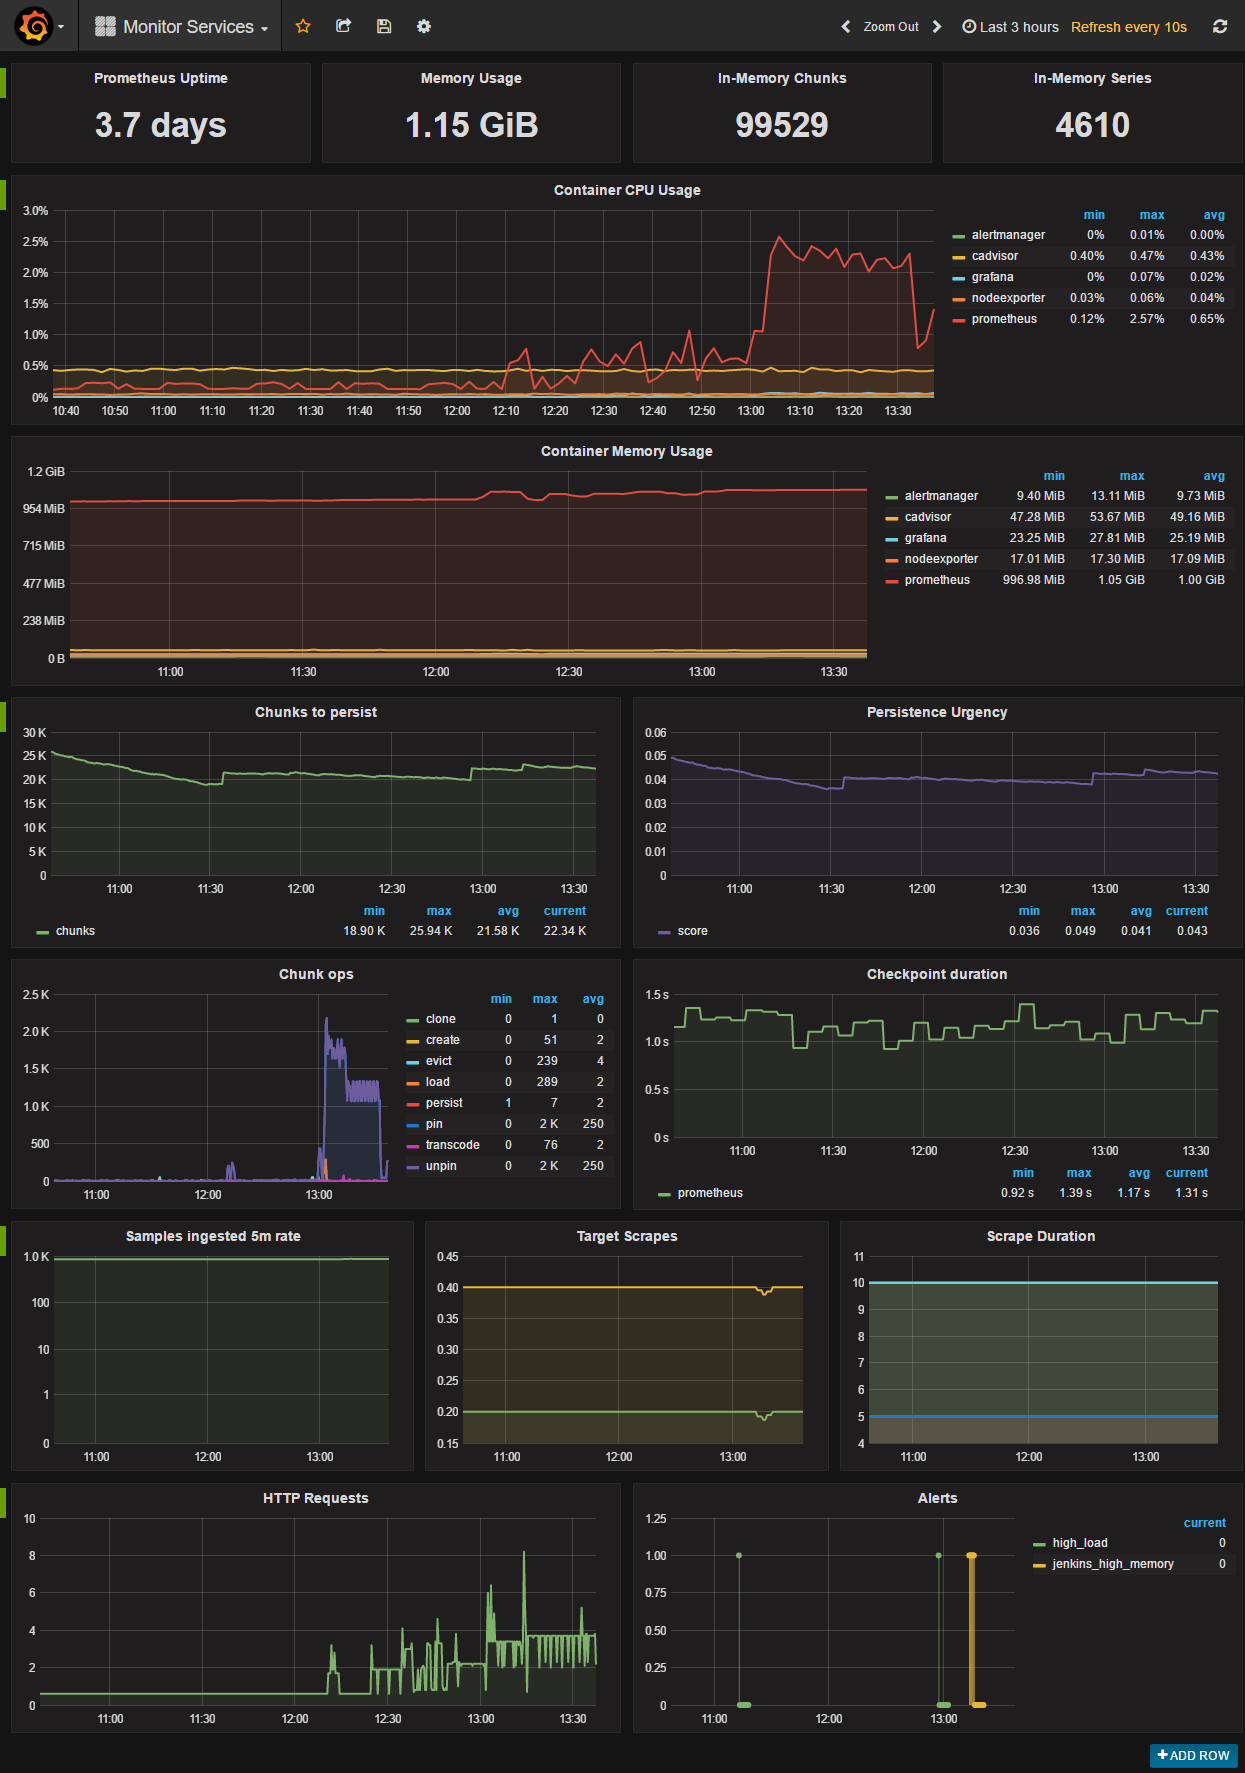
The Monitor Services Dashboard shows key metrics for monitoring the containers that make up the monitoring stack:
- Prometheus container uptime, monitoring stack total memory usage, Prometheus local storage memory chunks and series
- Container CPU usage graph
- Container memory usage graph
- Prometheus chunks to persist and persistence urgency graphs
- Prometheus chunks ops and checkpoint duration graphs
- Prometheus samples ingested rate, target scrapes and scrape duration graphs
- Prometheus HTTP requests graph
- Prometheus alerts graph
Setup Alerting
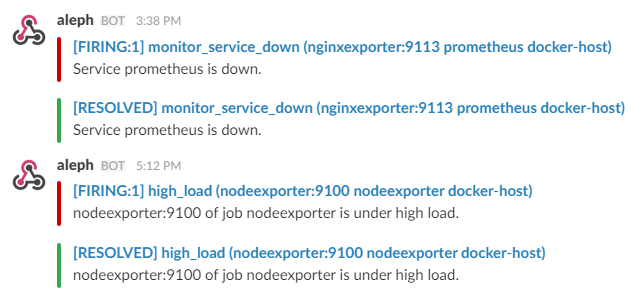
The notification receivers can be configured in alertmanager/config.yml file.
To receive alerts via Slack you need to make a custom integration by choose incoming web hooks in your Slack team app page. You can find more details on setting up Slack integration here.
Copy the Slack Webhook URL into the api_url field and specify a Slack channel.
route:
    receiver: 'slack'

receivers:
    - name: 'slack'
      slack_configs:
          - send_resolved: true
            text: "{{ .CommonAnnotations.description }}"
            username: 'Prometheus'
            channel: '#<channel>'
api_url: 'https://hooks.slack.com/services/<webhook-id>'- Clone this repository
git clone git@github.com:nfndp/nfndp-docker.git - Open your terminal then go to
nfndp-dockerfolder - Type:
make docker-run      # or
./docker-build.sh    # or
/bin/sh ./run.sh
Docker Portainer
- Create credential access:
username: laradock
password: password
- Select local containers
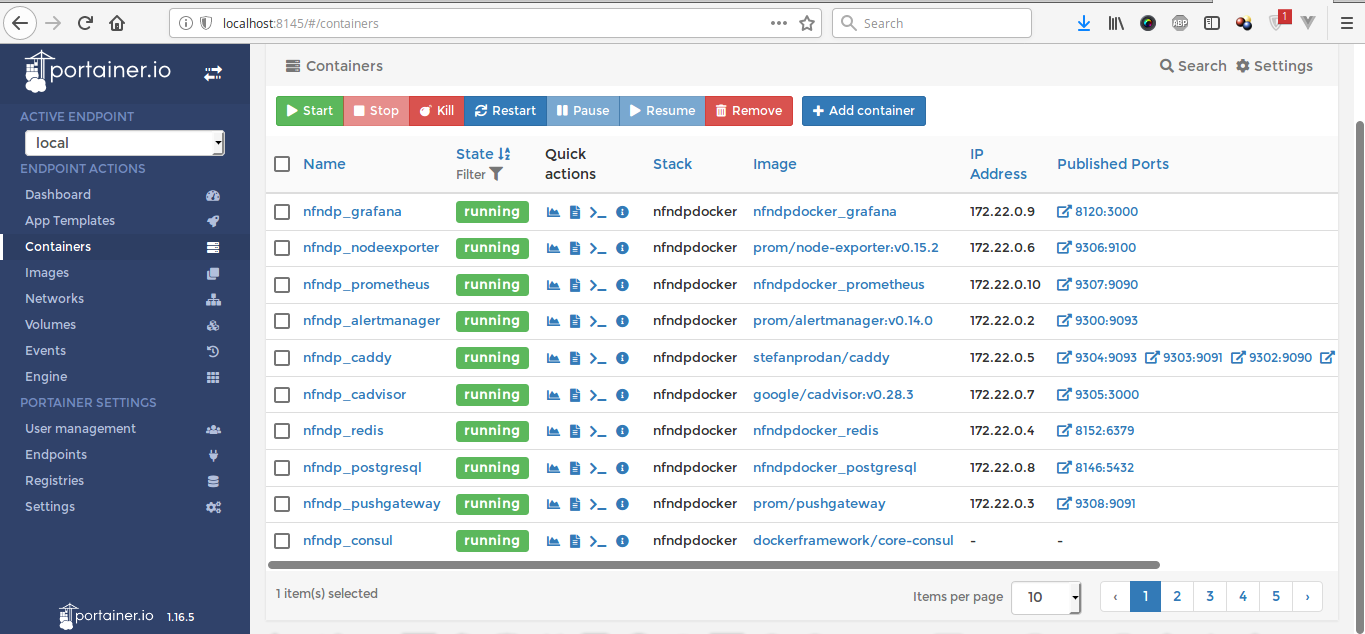
Running in browser
- Grafana: localhost:8120
- NodeExporter: localhost:9306
- Prometheus: localhost:9307
- Caddy:
- cAdvisor: localhost:9305
- Redis: localhost:8152
- PostgreSQL: localhost:8146
- Pushgateway: localhost:9308