Home
The refine-opentree project was created as part of the Tree-for-all Hackathon and this tutorial shows the use of the module.
This tutorial assumes that you have OpenRefine installed and this module installed as an extension.
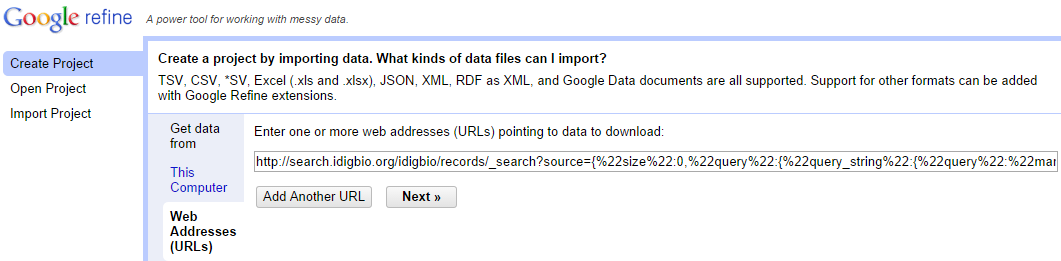
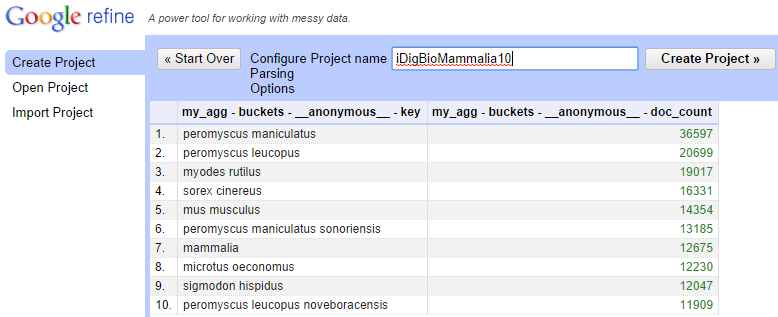
Before using the refine-opentree component, you first need to create a project with your dataset. One possibility is to load scientific names from a query against the iDigBio specimen repository. For that, while creating a new project, choose the "Web addresses (URLs)" option and to search for the top 10 mammal species present in iDigBio enter:
http://search.idigbio.org/idigbio/records/_search?source={%22size%22:0,%22query%22:{%22query_string%22:{%22query%22:%22mammalia%22}},%22aggregations%22:{%22my_agg%22:{%22terms%22:{%22field%22:%22scientificname%22,%22size%22:10}}}}
Choose to parse the returned data as "JSON files" and select the "my_agg" node.
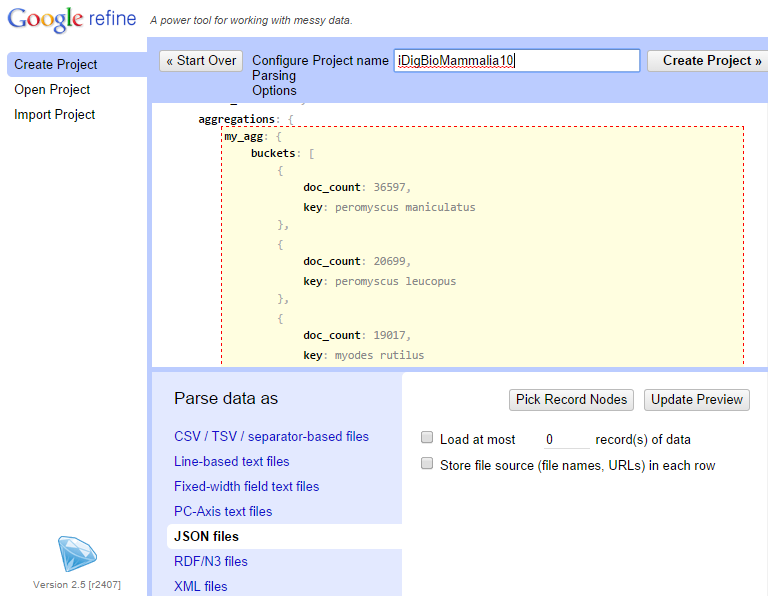
The resulting table should be a table where the first column is made of top 10 scientific names and the second column contains the number of specimens with the name in iDigBio. Provide a name such as "iDigBioMammalia10" to this project and create the project.
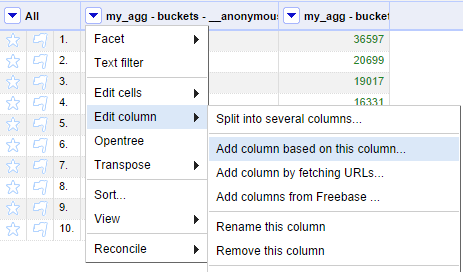
With a column of scientific names in your project, the next step is to retrieve the OpenTree Taxonomy IDs (OTT IDs) for each name. This is where one of the modules in this repository can help. Select the option to add a new column based on the scientific name column.
Give a name such as "ottId" to this new column and add the following Jython code. The resulting values are also shown in the preview table.
import tnrs
return tnrs.getOttId(value)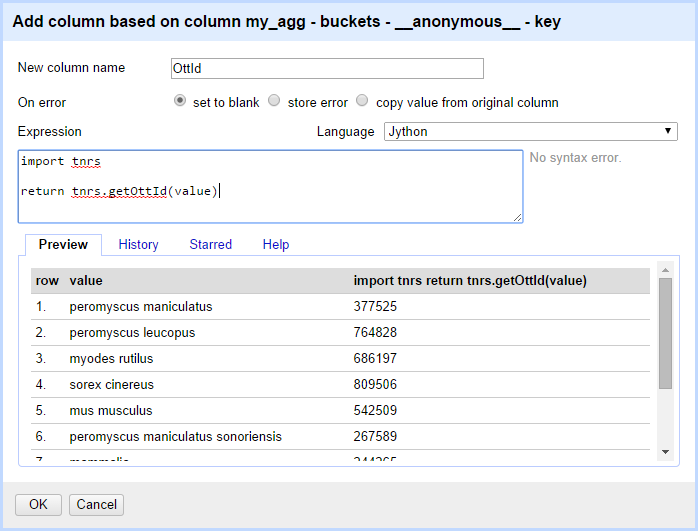
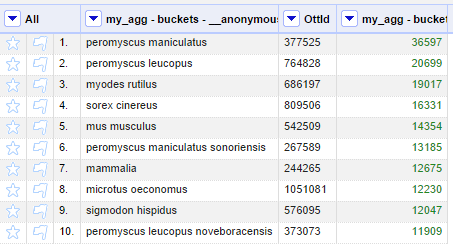
The table in the project has now an additional ottId column:
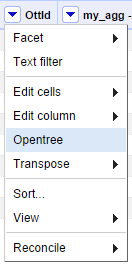
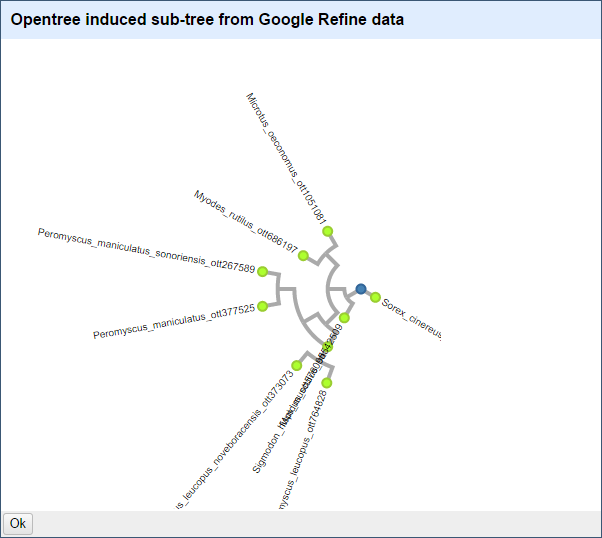
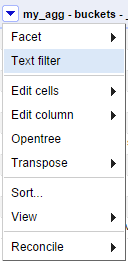
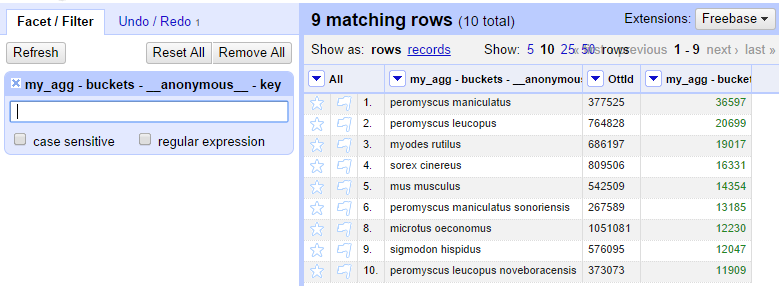
With a column of OTT IDs, it is possible to use the other component included in this repository: the tree visualizer, based on the OpenTree induced tree service. Before this functionality can be used, we need to ensure that higher-level taxonomy is not mixed with lower-level names. In this example, we see "Mammalia" in row 7 as one of the scientific names that are higher than the others. One trivial method to remove the monomials in this example, is to use a "Text filter" to remove rows based on the scientific name column.
Once the filter requiring a space is applied, row 7 will disappear from the table.
With a list of OTT IDs, we can now use the visualization module selecting the option "OpenTree" from the menu.