Blockchain performance slows down after a period of time #595
Comments
|
The following screenshot, shows the high increase in disk reads when the issue starts to occur
|

viquezclaudio
added a commit
that referenced
this issue
Feb 10, 2022
This flag improves the DB performance in Linux based platforms, which solves
the high disk reads issue described in #595.
viquezclaudio
added a commit
that referenced
this issue
Feb 10, 2022
This flag improves the DB performance in Linux based platforms, which solves
the high disk reads issue described in #595.
viquezclaudio
added a commit
that referenced
this issue
Feb 10, 2022
This flag improves the DB performance in Linux based platforms, which solves
the high disk reads issue described in #595.
|
Marking the issue as solved, as the performance degradation that is now observed, after introducing the NORDAHEAD flag is just a consequence of running out of memory (disk cache) and disk space, which can occur if a full history node does not have enough resources to maintain all the data that is generated.
|
Sign up for free
to join this conversation on GitHub.
Already have an account?
Sign in to comment
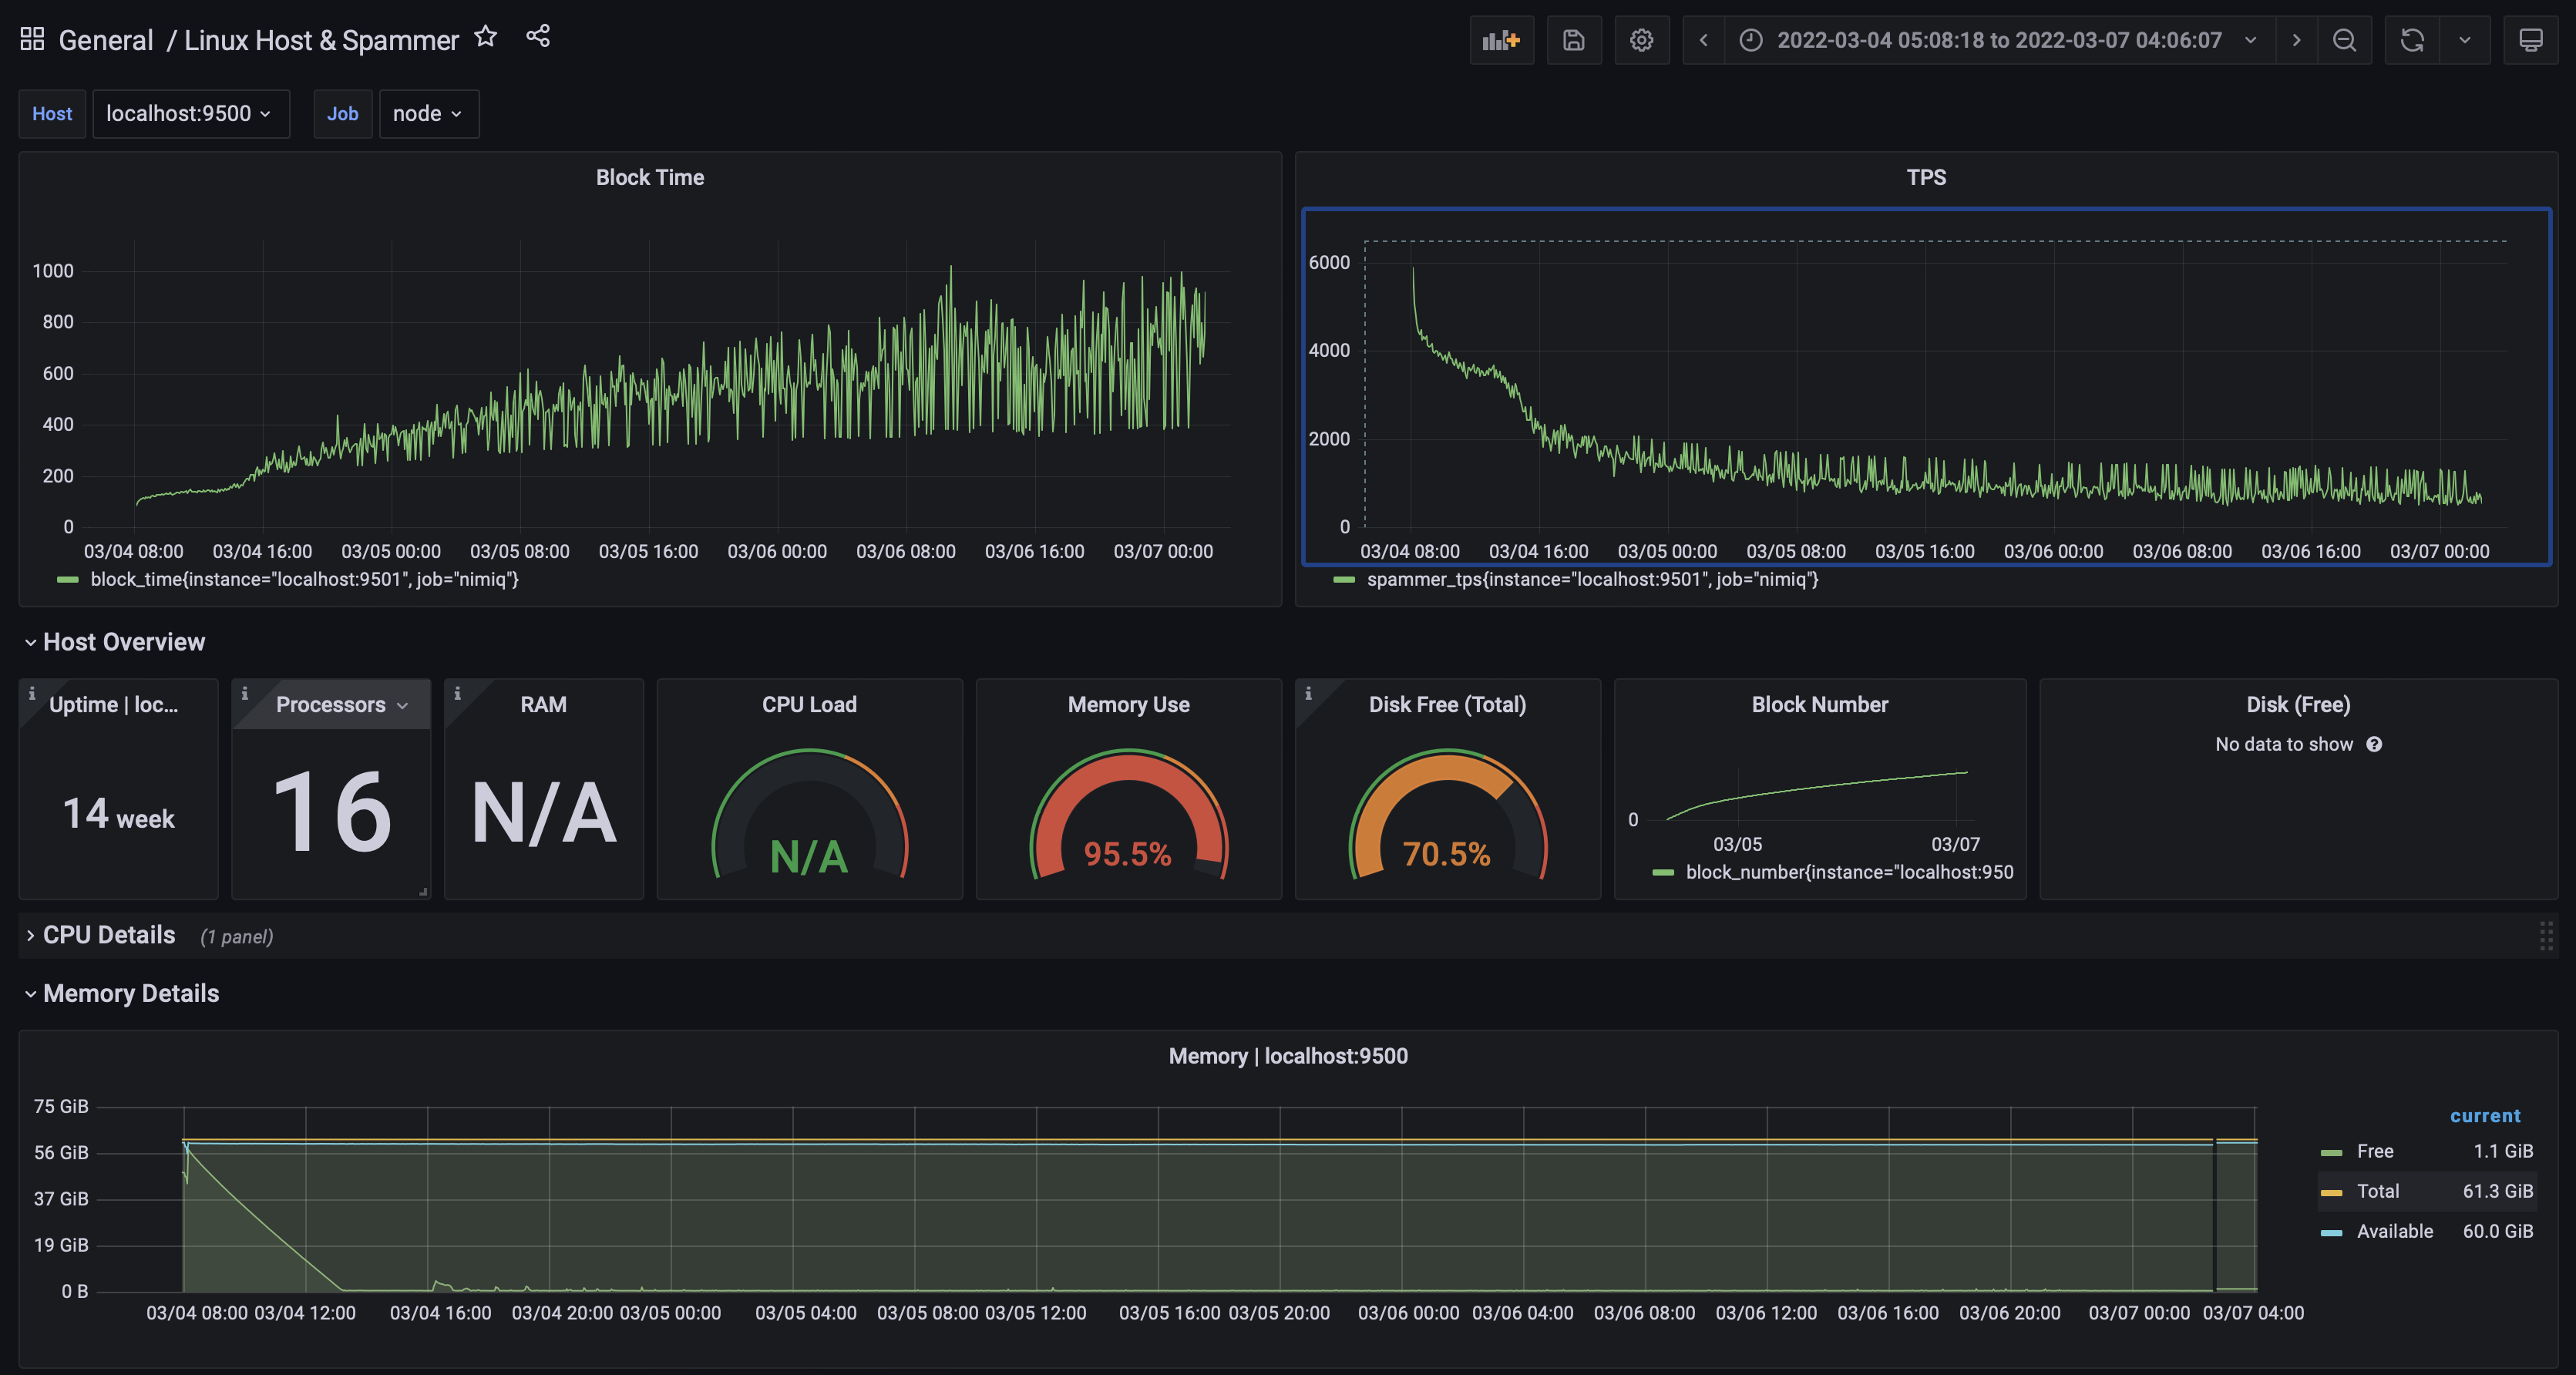
it has been observed that, after starting the devnet and sending transactions to it, there is a point of time (which depends upon the amount of transactions that are sent) where the chain starts to slow down.
This is observed by:
Several metrics have been collected, with Grafana, that show this problem.
We are currently investigating if this is a problem with our code or the data structures that are used to store information in the database, or the database itself.
It is important to mention that this screenshot was taken from the minimum scenario where this has been observed, which is a client pushing transactions to itself which rules out the possibility of a network problem, and also, this is why such a huge amount of TPS is observed at the beginning, which does not correspond to a more realistic scenario where there are multiple nodes over a network and some other nodes sending transactions to the network (although the issue has been observed in this latter scenario as well)
The text was updated successfully, but these errors were encountered: