Blazing fast speed-tests
###every-bit-matters contest entry 2016 By Nicolas Almagro Tonne - me@nixo.no - BiT - NTNU
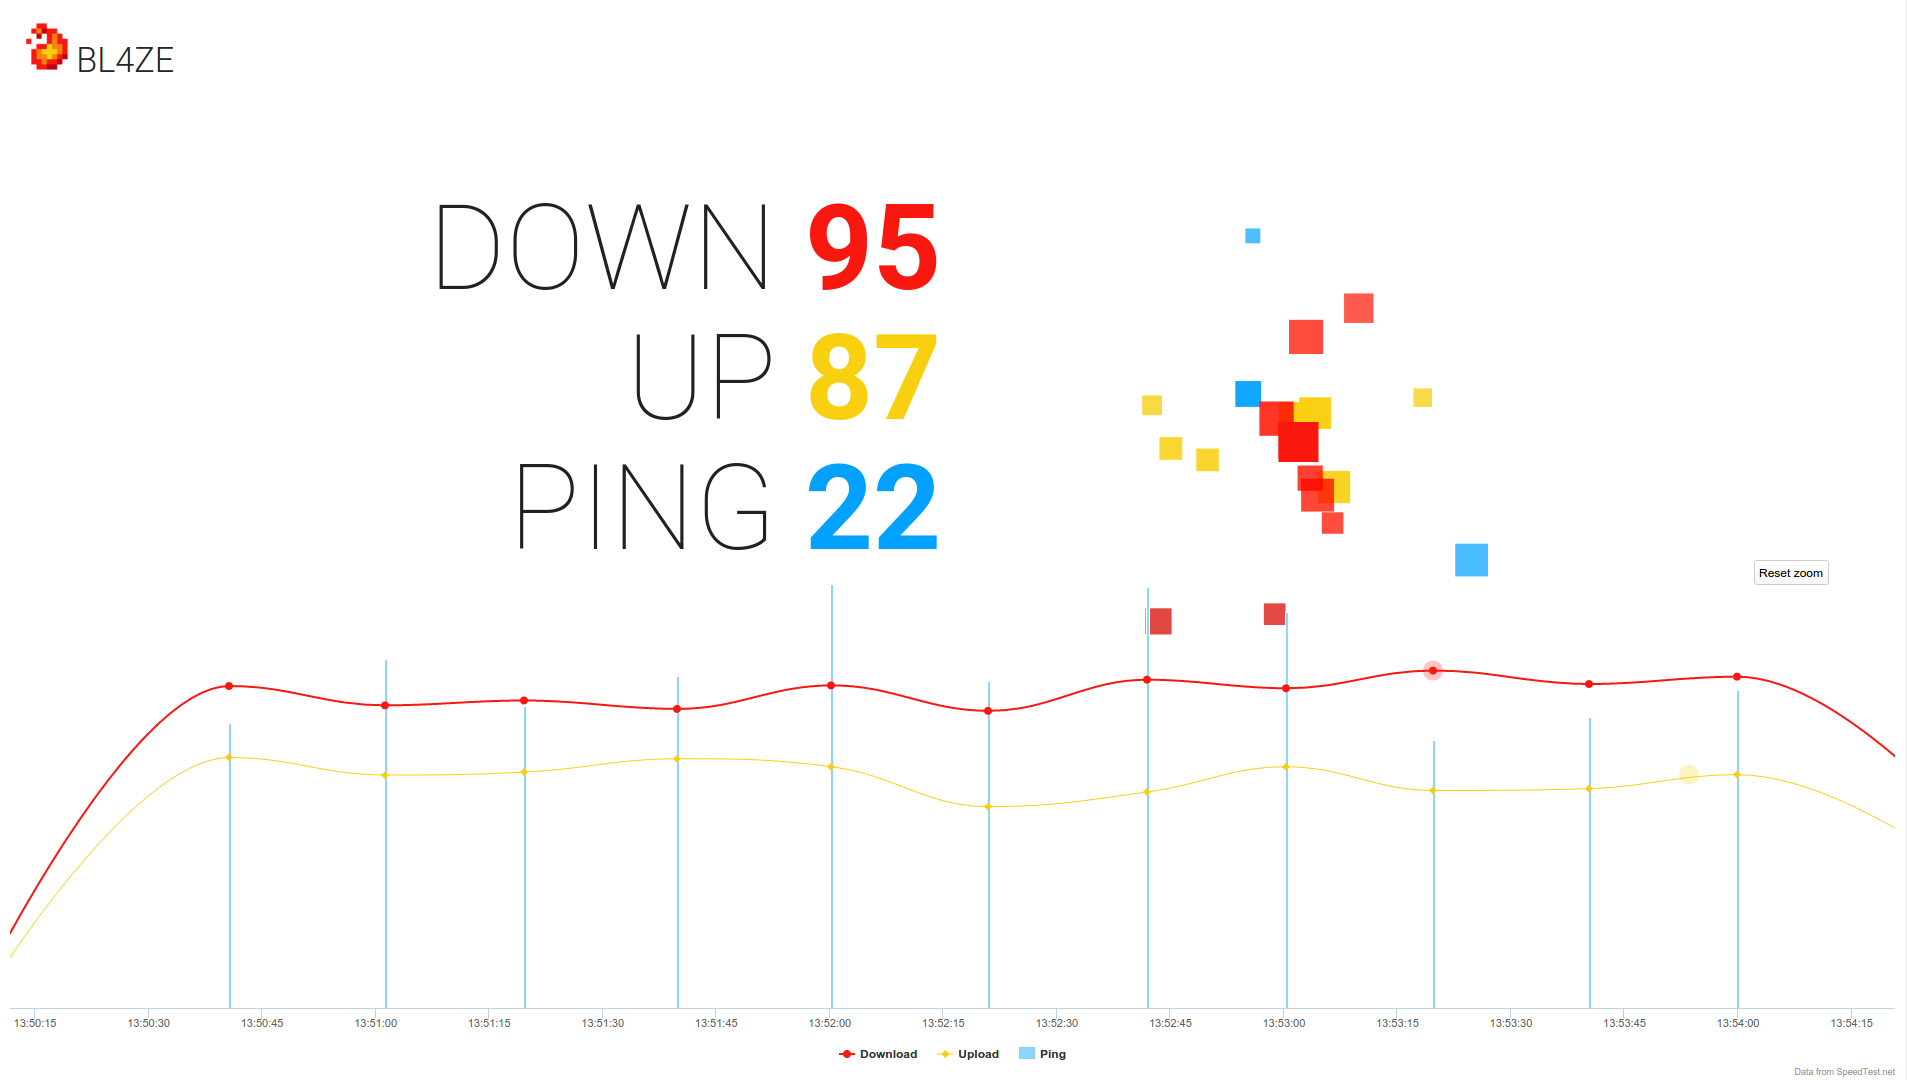 A screenshot of the speed test visualization
- Current/latest speed displayed separately
- Responsive graph with historical data
- Updated dynamically
- Zoomable & pannable
- Toggle what information to show
- Visualization of network speed and latency
- Upload & download speed separated and visualized by particle speed
- Ping visualized by only spawning a new particle every PING milliseconds
- Stats
- Top dl & ul speed
- Shortest ping time
- Sortable table with historic data
- ???
- Logger history data structure has been kept as is.
- Logger will only run one speed test at a time
- Logger will only send whole test history on first connect.
- Added partial data sending functionality to server.js
- Switch to branch 'master'
- Install npm packages (same as forked project):
npm install . - Run
node logger/logger.jsandnpm start - Navigate to
http://localhost:3000 - Wait for logger data if you have none
- Leave it running for a minimum of 30 mins to see the graph propely
- A demo with random data is running on
http://bl4ze.herokuapp.comor you can checkout thedemobranch. - Select a time period in the graph to zoom in on it
- Display ping data in the graph by clicking the disabled Ping label at the bottom