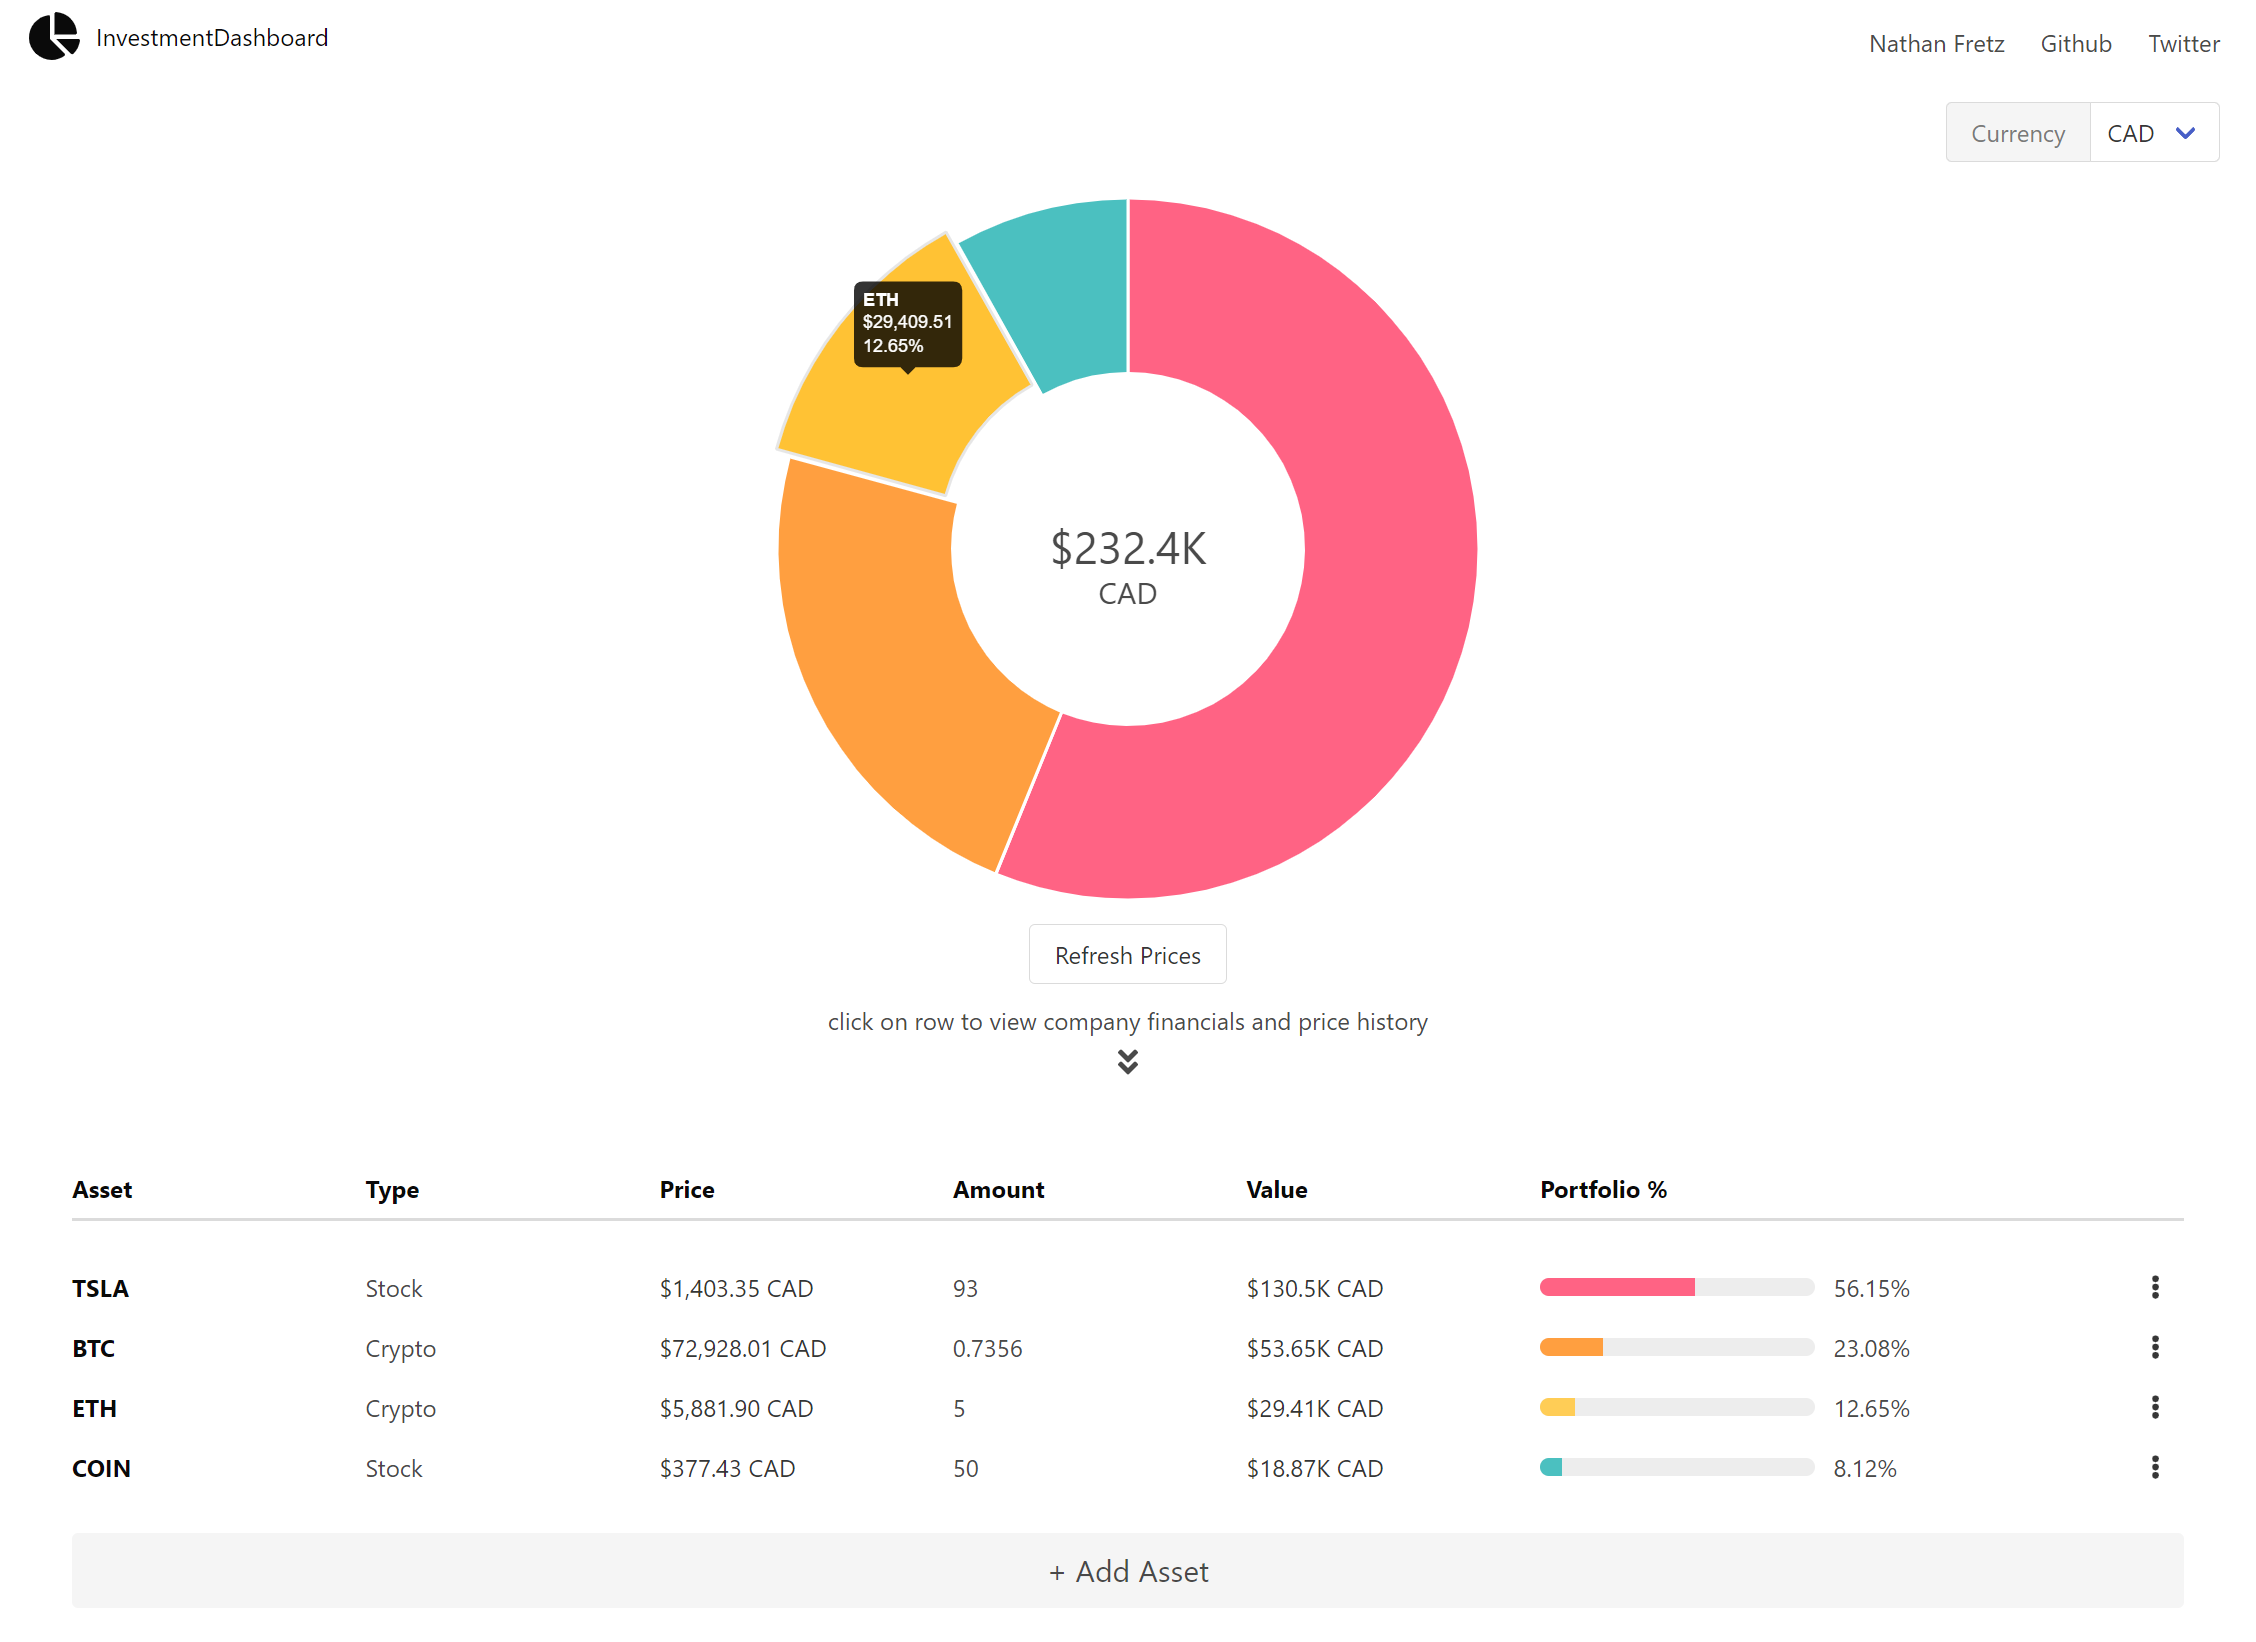
An investment dashboard for tracking a user's portfolio of assets, charting price history for stocks and crypto assets, and charting company financials.
Front end currently deployed on netlify at https://investment-dashboard.netlify.app/


- React Framework for frontend build
- 📊 Chart.js library used for graphing portfolio breakdown, company financials, and asset price history
- Doughnut chart of portfolio holdings
- View all company financial charts available through HyperCharts (e.g., revenue segments, cash flow, etc...)
- View historical stock and crypto prices by time range
- 💱 money.js library used for currency conversion (see backend below for exchange rate API)
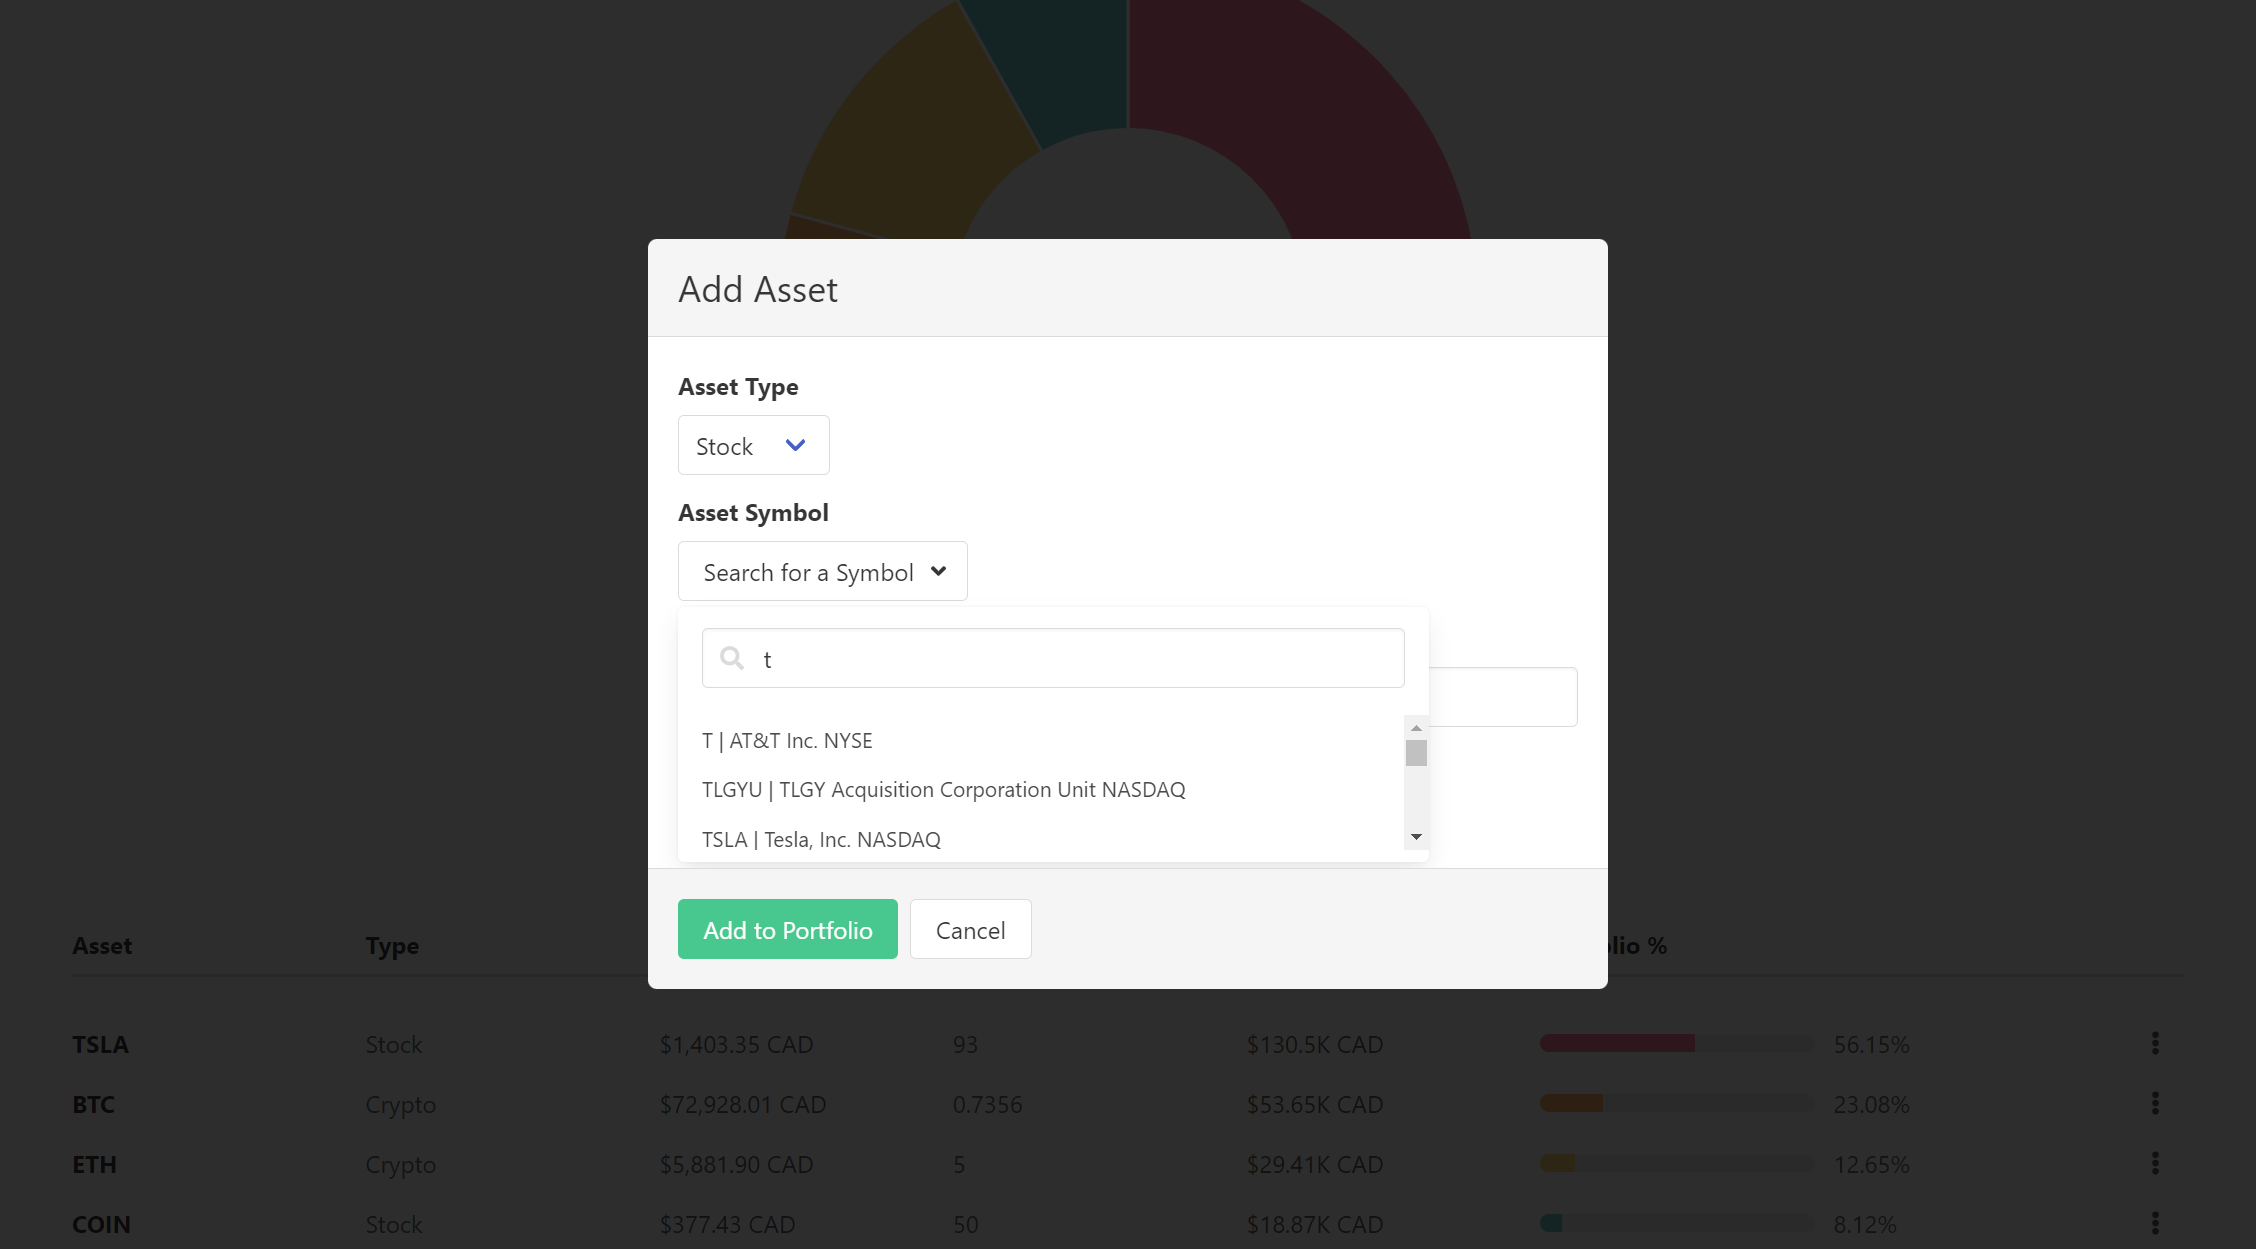
- 🔭 Search functionality for stocks and crypto assets
- 🧠 Financial and price data cached to limit API calls
- 🐮 Bulma.io CSS framework
- 📋 Asset portfolio persists in local storage. Database ( MongoDB) currently in development to make this application full stack 🥞.
- 🐕 Fetches data from the following APIs:
- HyperCharts API for company financials
- Alpha Vantage API for stock and crypto price history
- Yahoo Finance for stock ticker search, current stock price, and exchange rates
- Coin Cap API for crypto symbol search
- Nomics API for current crypto price
- express library for server/routing
- express-slow-down library (middleware for express) to slow down requests to Nomics API, which has a 1 request per second rate limit
- cors library (middleware for express) for adding CORS headers to responses
- Remove cache items that no longer exist in portfolio
- Add summary to AssetInfo.js that includes: uncompacted stock price, amount, value, portfolio percent
- CSS:
- Size and padding of doughnut chart
- White space
- Add proper error handling for all get requests.
- Doughnut chart:
- Colour scheme for graph
- Make doughnut chart tooltips more readable
- Don't show tootlip when there is no data
- Properly handle scenario where user quickly clicks on multiple assets which issues multiple requests to backend
- Consider auto-refreshing prices every 5 min instead of on button-click
- Consider organizing components into subfolders
- Resolve react warnings in console
- Add database instead of persisting assets in local storage
- Add proper error handling for all get requests.
- Add functionality for multiple users requesting data.
Run npm install in the following directories:
backend serverfrontend-react
Rename .env.sample to .env and update with your API keys:
- HyperCharts API for company financials
- Alpha Vantage API for stock and crypto price history
- Coin Cap API for crypto symbol search
- Nomics API for current crypto price
No API key required for Yahoo Finance (stock ticker search, current stock price, and exchange rates)
Start server with nodemon.
cd backend-server
npm run dev
Start frontend with react-app
cd frontend-react
npm run dev
Back end server currently deployed on heroku at https://financial-investment-dashboard.herokuapp.com/
-
Deployed from github subdirectory server using https://github.com/timanovsky/subdir-heroku-buildpack.git
- add above github url as first heroku buildpack
- add heroku nodejs as section buildpack
Front end currently deployed on netlify at https://investment-dashboard.netlify.app/
Build the frontend for production with npm run build. Deploy the build folder.
Change const SERVER_URL in frontend-react/build/src/fetch-requests/end-points.js to url of your server