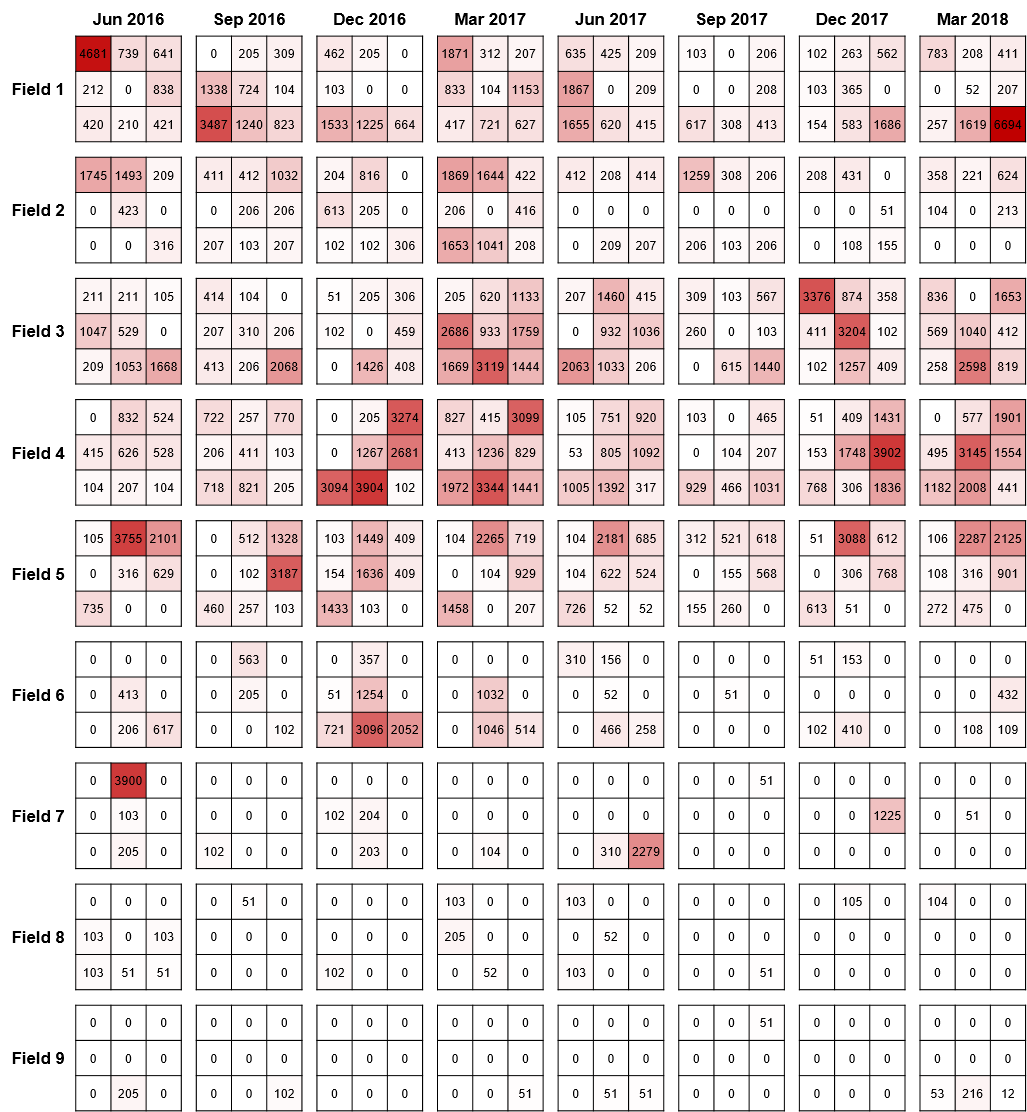
Heat maps of a 2 year agricultural soil survey across the Inland Pacific Northwest. Each subplot represents a 3 × 3 sampling region consisting of 9 quadrats 1 acre (4047 m^2) in size. Rows of subplots represent different fields (N=9), columns represent different sampling iterations (N=8). Values within each quadrat are F. culmorum propagules per gram soil (PPG). The specific values do not represent the precision of the soil dilution procedure, but are the result of standardizing counts by the moisture content of the soil samples. The sampling region within a field, along with quadrat positions, remained constant across all sampling iterations.
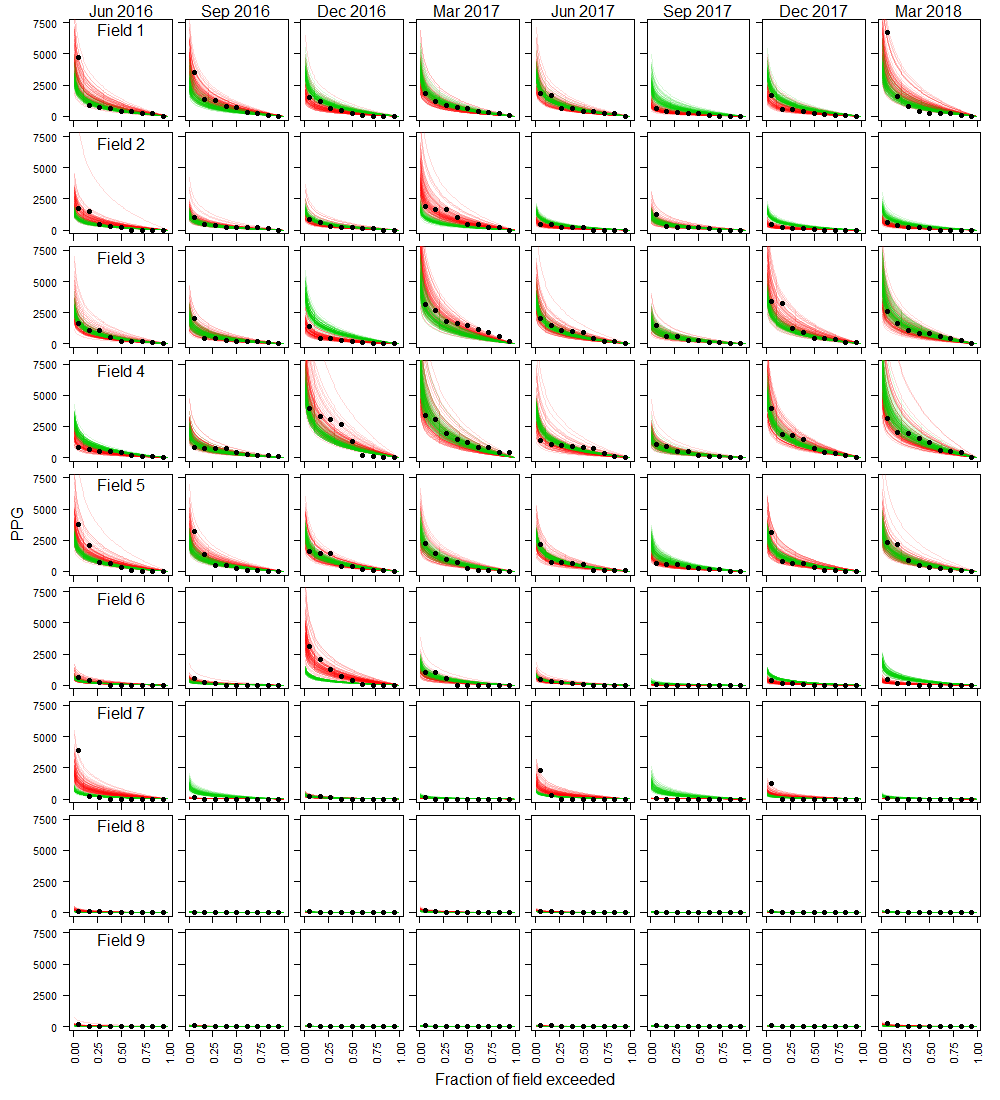
Exceedance curves of F. culmorum propagules per gram soil (PPG) in agricultural soil across the Inland Pacific Northwest over a 2 year soil survey. Rows of subplots represent different fields (N=9), columns represent different sampling iterations (N=8). Black points indicate observed values. Uncertainty in modelled rate parameters is visualized by plotting 100 samples from the posterior distribution as frequency of exceedance curves for both the reference model (red) and climate model (green).
Measured versus predicted F. culmorum propagules per gram soil (PPG) in agricultural soil. Measured values of F. culmorum PPG ploted against the predicted range of PPG at the same frequency of exceedance as observed for both (A) the reference model and (B) the climate model. Error bars denote the inter-quantile range of the posterior distribution.
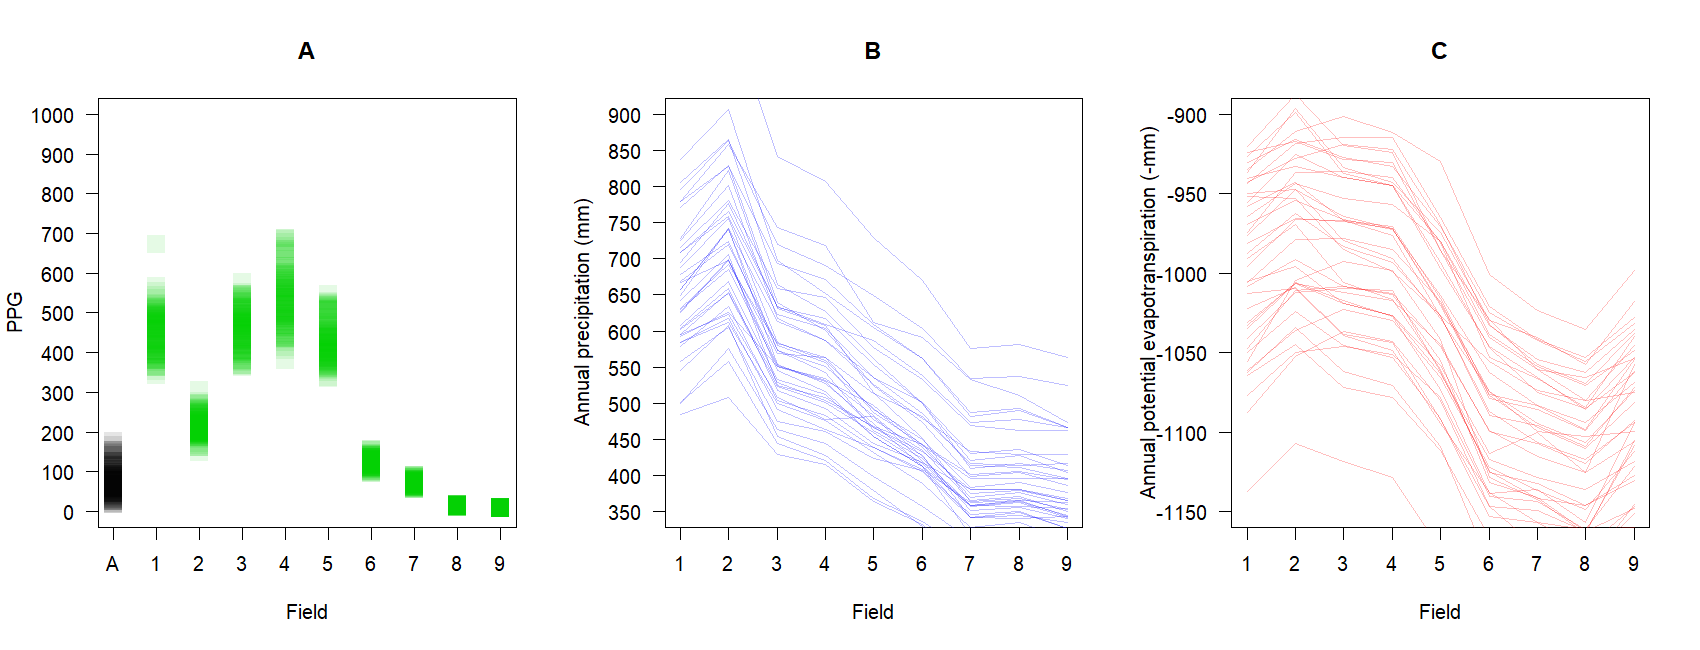
Posterior distributions of the median value of F. culmorum propagules per gram soil (PPG) from 9 fields across the Inland Pacific Northwest and their relationship with annual climate variables. (A) The median value of the population average (A) is in black. Uncertainty is visualized by plotting 100 random samples from the posterior distribution. The resulting distribution is corresponding to the uncertainty in estimating rate parameters and is not representative of the total variability of PPG values that would be observed within a field. (B) Annual precipitation (mm) for all sampled fields, from 1979 to 2017. Each line represents total annual precipitation across fields for a given year (N=39). (B) Annual potential evapotranspiration (-mm) for all sampled fields, from 1979 to 2017. Each line represents total annual precipitation across fields for a given year (N=39).
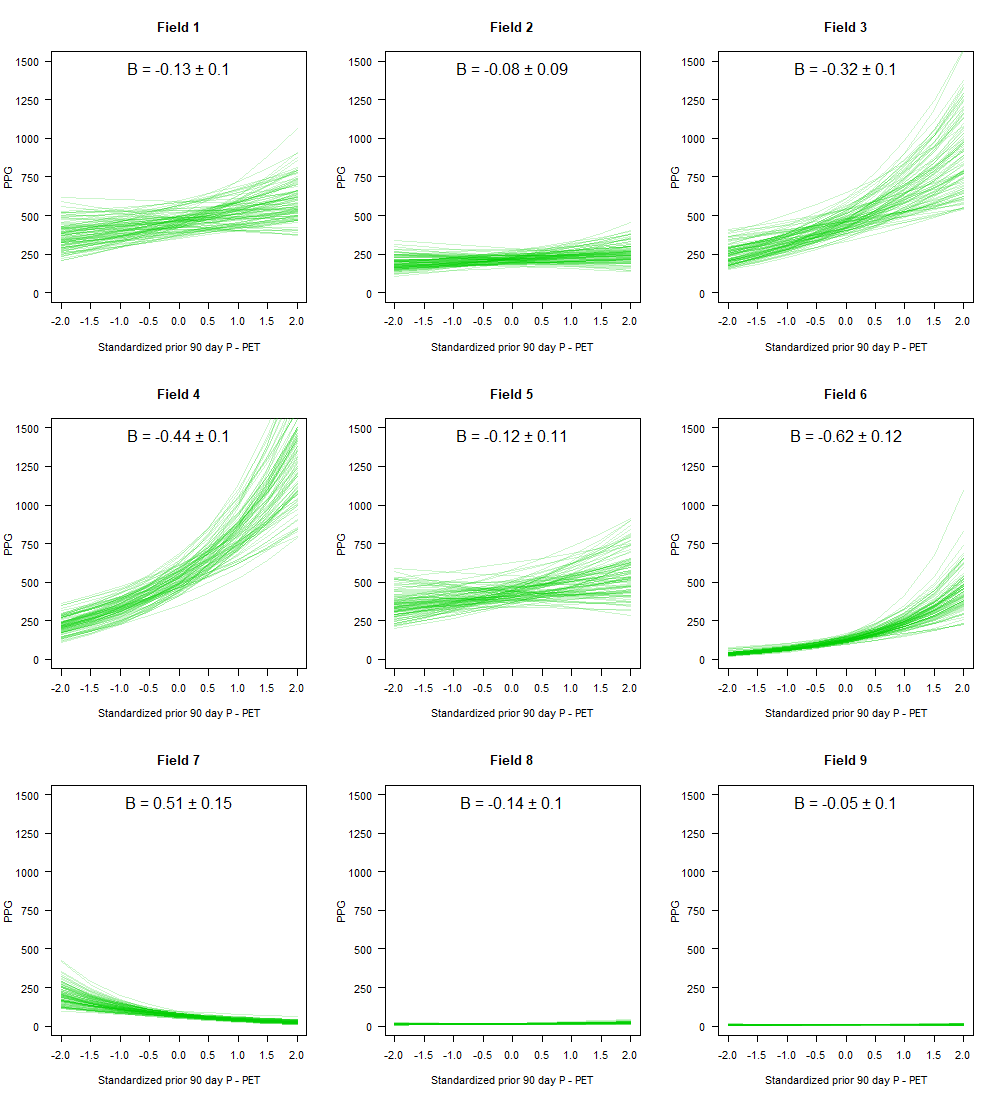
Predicted seasonal changes in the expected value of F. culmorum propagules per gram soil (PPG) based on different fields across the Inland Pacific Northwest (N=9). The model input parameter was the 90 day total precipitation (P) minus prior 90 day grass-reference potential evapotranspiration (PET) prior to sampling date. Values were standardized to mean 0 and standard deviation 1 prior to initializing the multilevel model and standardized values are shown on the top axis of each subplot. Green lines represent predictions for the expected value of F. culmorum and uncertainty is visualized by plotting 100 random samples from the posterior distribution of a multilevel model with varying intercepts and slopes for all fields. The mean and standard deviation of the posterior distribution for the effect of AWB (B) is shown for each field. The resulting distribution is corresponding to the uncertainty in estimating rate parameters and is not representative of the total variability of PPG values that would be observed within a field.
Forecasted changes in median F. culmorum soil populations across the Inland Pacific Northwest under climate change. The posterior median (M) value for F. culmorum propagules per gram soil (PPG) is shown for each sampled field (N=9). The proportion of a given field which is greater than M for all months is shown using either the historical baseline from 1950 – 2005 (black), RCP 4.5 from 2006-2099 (blue), and RCP 8.5 from 2006 – 2099 (red). The colored range is the interdeclie range of all years within the historical (N=54) and forcing (N=93) experiments. The resulting distribution is corresponding inter-annual variability and is not representative of the total variability of PPG values that would be observed within a field.
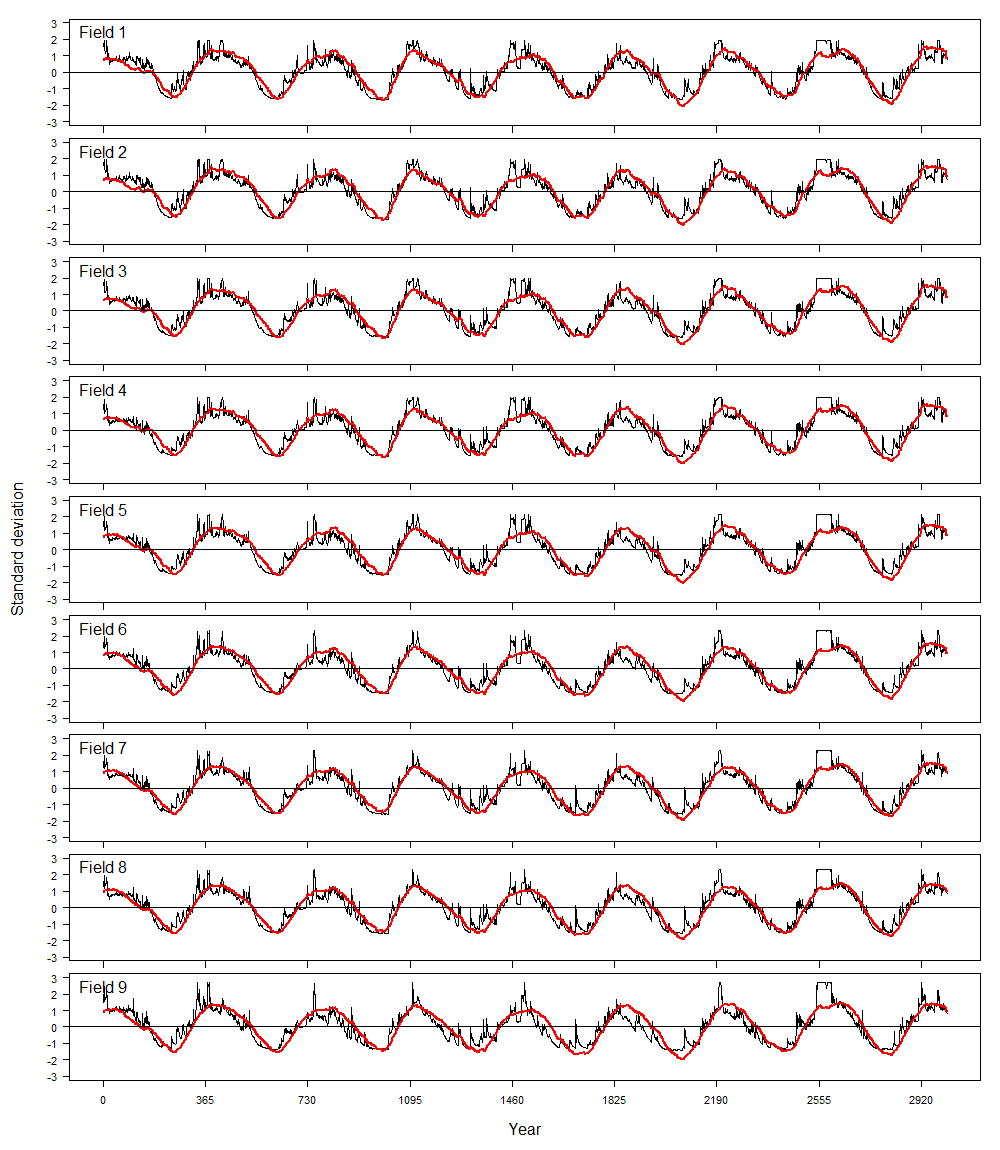
Daily modelled surface (5 cm) soil moisture (black) and daily atmospheric water balance (red) from January 21st 2010 to March 31st 2018 for all sampled fields (N=9). The atmospheric water balance (AWB) represents the prior 90 day total precipitation minus prior 90 day grass-reference potential evapotranspiration. Both soil moisture and AWB were standardized to mean 0 and standard deviation 1 prior to plotting to have complimentary scales. The modelled daily soil moisture came from the NCEP Climate Forecast System Reanalysis dataset.