Skip to content
New issue

Have a question about this project? Sign up for a free GitHub account to open an issue and contact its maintainers and the community.

By clicking “Sign up for GitHub”, you agree to our terms of service and privacy statement. We’ll occasionally send you account related emails.

Already on GitHub? Sign in to your account

[cuda] lineinfo for device function #5311

Closed
sklam opened this issue Feb 25, 2020 · 19 comments
Closed

[cuda] lineinfo for device function #5311

sklam opened this issue Feb 25, 2020 · 19 comments
Labels
CUDA CUDA related issue/PR discussion An issue requiring discussion

Comments

@sklam
Copy link
Member

sklam commented Feb 25, 2020

Related gitter discussion starting at here and here.
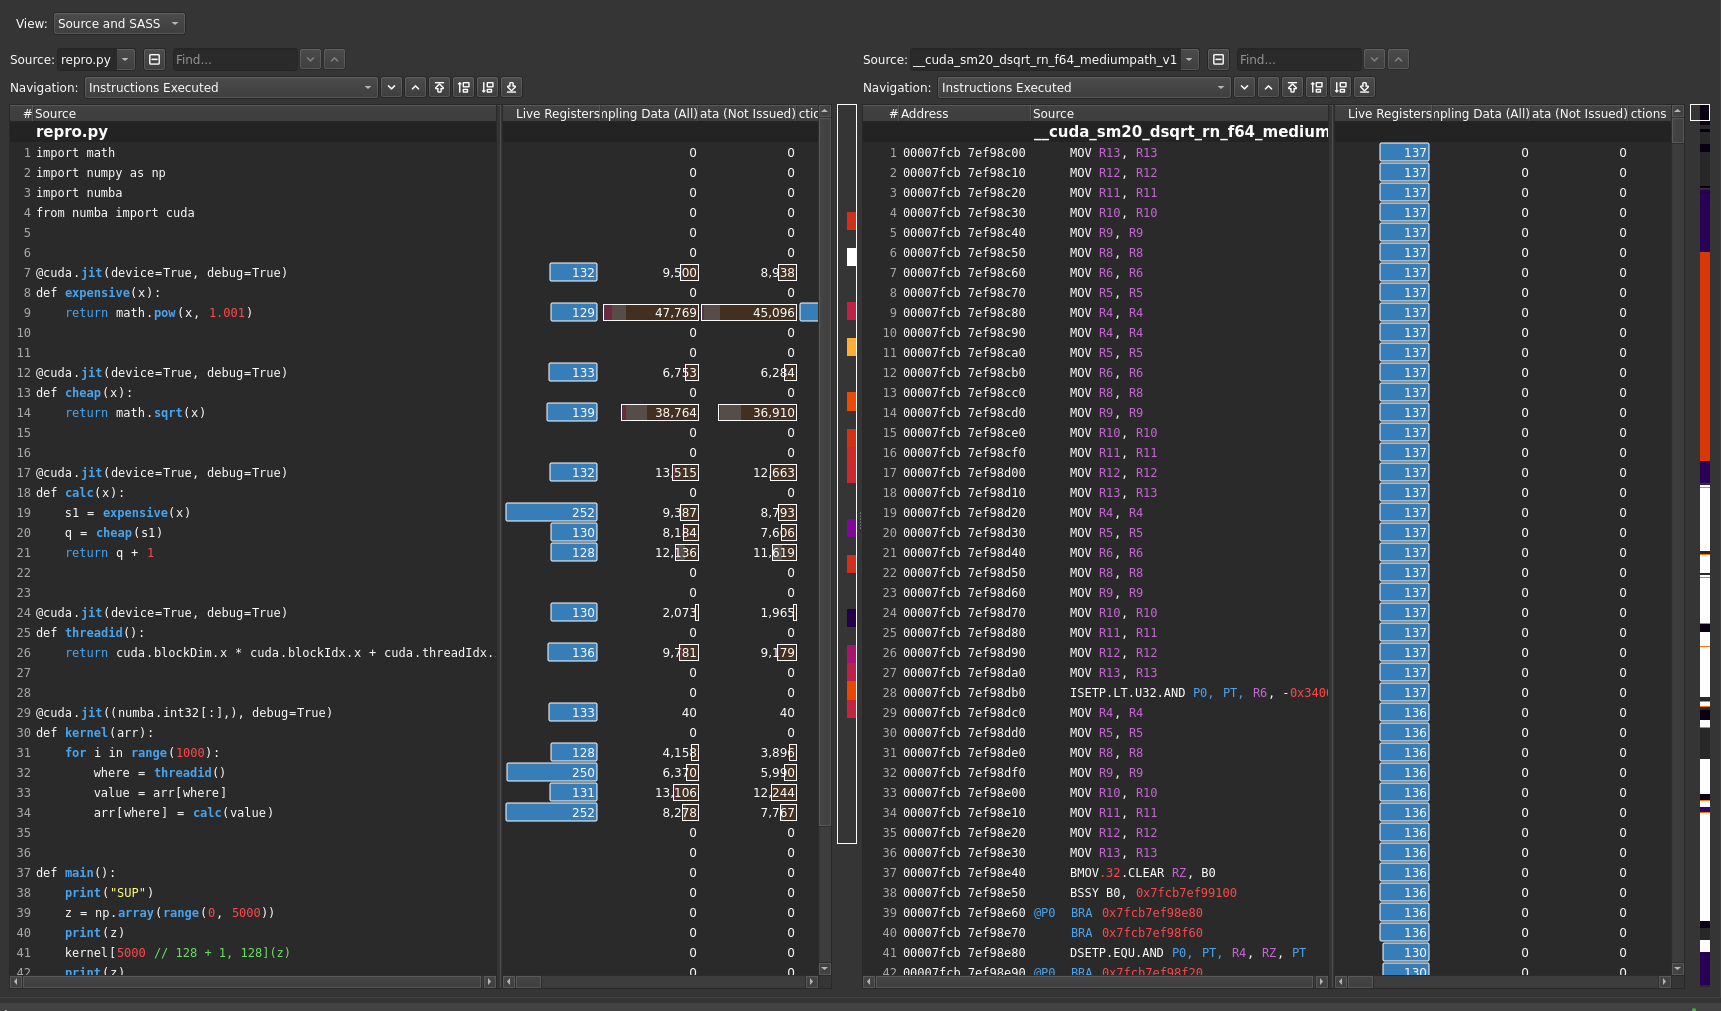
Reproducer:

# filename: debugme.py
import math
import numpy as np
import numba
from numba import cuda


@cuda.jit(device=True, debug=True)
def expensive(x):
    return math.pow(x, 1.001)


@cuda.jit(device=True, debug=True)
def cheap(x):
    return math.sqrt(x)


@cuda.jit(device=True, debug=True)
def calc(x):
    s1 = expensive(x)
    q = cheap(s1)
    return q + 1


@cuda.jit(device=True, debug=True)
def threadid():
    return cuda.blockDim.x * cuda.blockIdx.x + cuda.threadIdx.x


@cuda.jit(argtypes=[numba.int32[:]], debug=True)
def kernel(arr):
    for i in range(1000):
        where = threadid()
        value = arr[where]
        arr[where] = calc(value)


def main():
    print("SUP")
    z = np.array(range(0, 5000))
    print(z)
    kernel[5000 // 128 + 1, 128](z)
    print(z)

    print(kernel.inspect_llvm())

if __name__ == '__main__':
    main()

Run the above with:

$ nvprof -a instruction_execution --export-profile profile_output python debugme.py

On my OSX 10.13 with CUDA 9.2, we can see some line-info in the profile_output using NVVP:

separate_devfns

The "inline-closure" version (this style: https://gist.github.com/c200chromebook/d131322c918b142f14f40c9b3583cc6d) looks like:
inlined_closure

@c200chromebook, can you tell us what you see?

@sklam sklam added CUDA CUDA related issue/PR discussion An issue requiring discussion labels Feb 25, 2020
@c200chromebook
Copy link
Contributor

c200chromebook commented Feb 26, 2020

Win 2016 Datacenter, CUDA 10.1, numba 0.48.0, numpy 1.18.1, llvmlite 0.31.0 - you don't even get near the profiling.

image

@c200chromebook
Copy link
Contributor

Using the goofy inline-closure format:
image

@sklam
Copy link
Member Author

sklam commented Feb 26, 2020

hmm... i think this might be a problem in libNVVM in CUDA 10.1. @gmarkall, do you know if there are known problems regarding debug-symbols in newer CUDA.

@c200chromebook
Copy link
Contributor

Yeah, you'll excuse me, I did very minorly goof - 10.2. Forgot we had upgraded.

@gmarkall
Copy link
Member

@sklam If you're referring to the appearance of the message "Debugging support cannot be enabled when the number of debug compile units is more than 1", it's a message I've bumped into before but hadn't yet got around to looking into... I didn't realise it ever did work with 9.2 though.

@stuartarchibald
Copy link
Contributor

I've also seen that message a fair few times.

@sklam
Copy link
Member Author

sklam commented Feb 28, 2020

@stuartarchibald, on what hardwares and CUDA versions?

@gmarkall
Copy link
Member

I've seen it with CUDA 10.0 and a V100.

@stuartarchibald
Copy link
Contributor

@stuartarchibald, on what hardwares and CUDA versions?

Stretching memory, but CUDA 10.2 and a GTX970.

@gmarkall
Copy link
Member

gmarkall commented Jun 9, 2020

hmm... i think this might be a problem in libNVVM in CUDA 10.1. @gmarkall, do you know if there are known problems regarding debug-symbols in newer CUDA.

I just noticed that it's documented that only a single module is supported: https://docs.nvidia.com/cuda/nvvm-ir-spec/index.html#source-level-debugging-support:

Source level debugging is supported only for a single debug compile unit. If there are multiple input NVVM IR modules, at most one module may have a single debug compile unit.

@sklam
Copy link
Member Author

sklam commented Jun 9, 2020

Hm... we can possibly prelink the module in llvm before sending it over to nvvm.

@c200chromebook
Copy link
Contributor

Is this one a fundamental limitation or should the prelink workaround fix?

@sklam
Copy link
Member Author

sklam commented Aug 13, 2020

@gmarkall, the doc change first happened in 10.0 (https://docs.nvidia.com/cuda/archive/10.0/nvvm-ir-spec/index.html#source-level-debugging-support). In 9.2 (https://docs.nvidia.com/cuda/archive/9.2/nvvm-ir-spec/index.html#source-level-debugging-support), there were no restriction on "a single debug compile unit" and it works.

Why is this restriction needed? I would think that one can use LLVM to link the modules together and the debug symbol will merge fine. If it is not that simple, I don't know what Numba can do to address this problem.

@c200chromebook is reporting (at https://gitter.im/numba/numba?at=5f35a6314bb58d3181951aea) that this affects a single kernel case in Numba. Which is odd because there should only be one LLVM module. Unless NVVM is counting the libdevice that we are linking in.

@c200chromebook
Copy link
Contributor

c200chromebook commented Aug 14, 2020

See also the below, which has two items to compile, thus causing a fail.

from numba import cuda
import numba as nb

@cuda.jit(nb.void(nb.int32[:], nb.int32[:]), debug=True)
def whatever(inp, outp):
    outp[0] = 1 if inp[0] in (2, 3) else 3


whatever[1, 1](cuda.device_array(1), cuda.device_array(1))

yields

Error: Debugging support cannot be enabled when number of debug compile units is more than 1
NVVM_ERROR_COMPILATION

This is an idiosyncrasy of the tuple, as you don't get it with:


@cuda.jit(nb.void(nb.int32[:], nb.int32[:]), debug=True)
def whatever(inp, outp):
    outp[0] = 1 if inp[0] == 2 or inp[0] ==3 else 3

@gmarkall
Copy link
Member

gmarkall commented Mar 18, 2021

On master with CUDA 11.2 (NVVM 7.0) line info seems to be available again with debug=True for the reproducer in the issue description:

image

@gmarkall
Copy link
Member

See also the below, which has two items to compile, thus causing a fail.

from numba import cuda
import numba as nb

@cuda.jit(nb.void(nb.int32[:], nb.int32[:]), debug=True)
def whatever(inp, outp):
    outp[0] = 1 if inp[0] in (2, 3) else 3


whatever[1, 1](cuda.device_array(1), cuda.device_array(1))

yields

Error: Debugging support cannot be enabled when number of debug compile units is more than 1
NVVM_ERROR_COMPILATION

This reproduces for me with CUDA 10.1, but the issue appears to be resolved with CUDA 11.2.

@gmarkall
Copy link
Member

To summarise where I think we are:

@sklam asked earlier:

Why is this restriction needed? I would think that one can use LLVM to link the modules together and the debug symbol will merge fine. If it is not that simple, I don't know what Numba can do to address this problem.

I don't know the reason for the restriction. I believe that we can conform with this restriction in Numba by changing

numba/numba/cuda/codegen.py

Lines 114 to 115 in 81f7082

irs = [str(mod) for mod in self.modules]
ptx = nvvm.llvm_to_ptx(irs, **options)

so that instead of passing a list of the IR for all modules into llvm_to_ptx, we call it once for each module's IR, then link the resulting PTX for each module one-by-one when linking the cubin. So here:

linker.add_ptx(ptx.encode())

we'd have multiple PTXs to add.

I hadn't done this by default so far because it seems to result in less inlining and less efficient code in the non-debug case (I did try it, but couldn't get the linker to inline the PTX as eagerly as NVVM seems to inline IR for device functions). For debug, this isn't a problem though, as we're not going to be expecting much / any inlining.

We have this hack in the code:

# XXX remove debug_pubnames seems to be necessary sometimes
return patch_ptx_debug_pubnames(ptx)
def patch_ptx_debug_pubnames(ptx):
"""
Patch PTX to workaround .debug_pubnames NVVM error::
ptxas fatal : Internal error: overlapping non-identical data
"""
while True:
# Repeatedly remove debug_pubnames sections
start = ptx.find(b'.section .debug_pubnames')
if start < 0:
break
stop = ptx.find(b'}', start)
if stop < 0:
raise ValueError('missing "}"')
ptx = ptx[:start] + ptx[stop + 1:]
return ptx

which is intended to workaround the fact we are passing in multiple modules when debug=True. If the above changes to pass one module to NVVM at a time are implemented, I believe that this workaround could be removed (and maybe debug info in CUDA would work a bit better than it presently does).

gmarkall added a commit to gmarkall/numba that referenced this issue Mar 18, 2021
Includes:

- Calls `llvm_to_ptx` once for each IR module for debug.
- Don't adjust linkage of functions in linked modules when debugging,
  because we need device functions to be externally visible.
- Fixed setting of NVVM options when calling `compile_cuda` from kernel
  compilation and device function template compilation.
- Removes debug_pubnames patch

Outcomes:

- The "Error: Debugging support cannot be enabled when number of debug
  compile units is more than 1" message is no longer produced with NVVM
  3.4.
- CUDA test suite passes, apart from those tests that check PTX, because
  get_asm_str() is returning a list of strings when debug is True.
- NVVM 7.0: Everything still seems to "work" as much as it did before.
  Stepping may be more stable, but this needs a bit more verification
  (could just be my late night perception).

Testing outside the test suite:

- Reproducers from Issue numba#5311 in the post description, and from
  c200chromebook.
- The code posted in Discourse thread 449, with debug=True, opt=0 added.

These will need to be made into appropriate test cases - they exposed
some problems with the linkage.
@gmarkall
Copy link
Member

instead of passing a list of the IR for all modules into llvm_to_ptx, we call it once for each module's IR, then link the resulting PTX for each module one-by-one when linking the cubin.

I've tried implementing this strategy and removing the debug_pubnames patching in: gmarkall@ce840bc

It fixes the failure to compile with NVVM 3.4. Things seem to work as well as they did before with NVVM 7.0. Stepping line-by-line seems like it might be more stable, but I'm not sure if that's just my perception - I need to do some more careful experiments.

@gmarkall
Copy link
Member

PR #6841 includes a fix for the message "Error: Debugging support cannot be enabled when number of debug compile units is more than 1" using the strategy described above - since lineinfo is working with NVVM 7.0, and the error message is resolved with NVVM 3.4, I will consider this issue resolved once that PR is merged.

Sign up for free to join this conversation on GitHub. Already have an account? Sign in to comment
Labels
CUDA CUDA related issue/PR discussion An issue requiring discussion
Projects
None yet
Development

No branches or pull requests

4 participants