This is a React module that creates a hierarchical chart using CSS styling. It is written in TypeScript and uses Emotion for styling. 💅
You can install this module using npm or yarn:
npm i react-horizontal-hiererchy-chart
or
yarn add react-horizontal-hiererchy-chart
To use this module, import it into your React component:
import HiererchyChart from "./react-horizontal-hiererchy-chart";
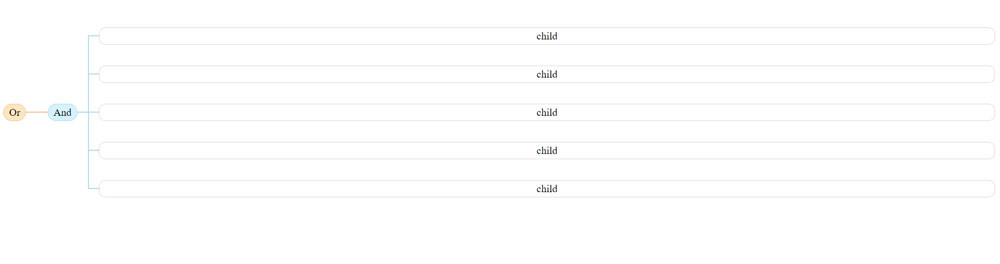
Then, create an object that represents the hierarchy of your chart. Each child object should have a content property which is the text to be displayed, a level property which represents the depth of the chart, and a border property which is the color of the lines that connect the nodes. Here's an example:
const items = {
  content: "Or",
  level: 1,
  childs: [
    {
      content: "And",
      level: 2,
      border: "red",
      childs: [
        {
          level: 3,
          content: "child",
          border: "red",
        },
        // ... more child items
      ],
    },
  ],
};
| props | Type | Description |
|---|---|---|
items |
content: Node Or string |
Required. items can be empty array |
cssClass:string |
optional. add custom class | |
border:string |
optional. liner between items | |
childs:Array of [items] |
optional. has child? add array of obj items | |
| modify | object of levels |
optional.want change some level?give level and take items |
Finally, render the HierarchyChart component and pass in the items object:
import { useState } from "react";
import HiererchyChart from "./react-horizontal-hiererchy-chart";
type hover = { value: boolean; index: number | null };
function App() {
  const [hover, setHover] = useState<hover>({ value: false, index: null });
  const items = {
    content: "Or",
    level: 1,
    childs: [
      {
        content: "And",
        level: 2,
        border: "rgba(242, 194, 150, 1)",
        childs: [
          {
            level: 3,
            content: "child",
            border: "rgba(178, 218, 235, 1)",
          },
          {
            level: 3,
            content: "child",
            border: "rgba(178, 218, 235, 1)",
          },
          {
            level: 3,
            content: "child",
            border: "rgba(178, 218, 235, 1)",
          },
          {
            level: 3,
            content: "child",
            border: "rgba(178, 218, 235, 1)",
          },
          {
            level: 3,
            content: "child",
            border: "rgba(178, 218, 235, 1)",
          },
        ],
      },
    ],
  };
  const handleMouseOut = () => {
    setHover({ value: false, index: null });
  };
  return (
    <div onMouseOut={handleMouseOut}>
      <HiererchyChart
        items={items}
        modify={{
          level1: ({ item }) => (
            <div
              style={{
                background: "rgba(255, 229, 190, 1)",
                border: "1px solid rgba(242, 194, 150, 1)",
                padding: ".2rem .5rem",
                borderRadius: "100px",
              }}
            >
              {item}
            </div>
          ),

          level2: ({ item }) => {
            return (
              <div
                style={{
                  background: "rgba(213, 242, 255, 1)",
                  border: "1px solid rgba(178, 218, 235, 1)",
                  padding: ".2rem .5rem",
                  borderRadius: "100px",
                }}
              >
                {item}
              </div>
            );
          },
          level3: ({ item, index }) => {
            return (
              <div
                style={{
                  background: "rgba(255, 255, 255, 1)",
                  padding: ".2rem .5rem",
                  borderRadius: "10px",
                  border: "1px solid rgba(138, 138, 138, .33)",
                  width: "100%",
                  textAlign: "center",
                  cursor: "pointer",
                  transition: "all 1s ease",
                  boxShadow:
                    hover.value && index === hover.index
                      ? "-2px 3px 22px -8px rgba(0,0,0,0.75)"
                      : "none",
                }}
                onMouseOver={() => {
                  setHover({ value: true, index: index });
                }}
              >
                {item}
              </div>
            );
          },
        }}
      />
    </div>
  );
}

export default App;
The modify prop allows you to customize the appearance of different levels of the chart. In this example, we're using it to change the background color of the first and third levels.
The module uses Emotion for styling. You can customize the appearance of the chart by modifying the CSS classes defined in the style variable at the bottom of the module.
This module is licensed under the MIT license. See the LICENSE file for more information.