

Official website: https://nextgenshinyapps.obi.obianom.com
A sample finished Modal shiny app: https://jimrb.shinyapps.io/modal-nGSA/
A sample finished Cards shiny app: https://r2apps.shinyapps.io/nextgenshinyapps-card/
Other packages required for nextGenShinyApps: https://depends.rpkg.net/package/nextGenShinyApps
Get started with sample R codes:
https://github.com/oobianom/nextGenShinyApps-Boilerplate-BlankApp
Please note that the nextGenShinyApps 1.7 is NOW compatible with the htmlwidgets,rhandsontable and plotly packages. This is being worked on, but there is not currently a completion date.
The nextGenShinyApps package is available on CRAN and can be installed as shown below
install.packages(nextGenShinyApps)
library(nextGenShinyApps)
# library
library(shiny)
library(nextGenShinyApps)
# Define UI
ui <- fluidPage(
# Theme: Select color style from 1-13
style = "6",
# Background: You may specify a background(optional)
custom.bg.color = "lightblue",
# Header: Insert header content using titlePanel ---
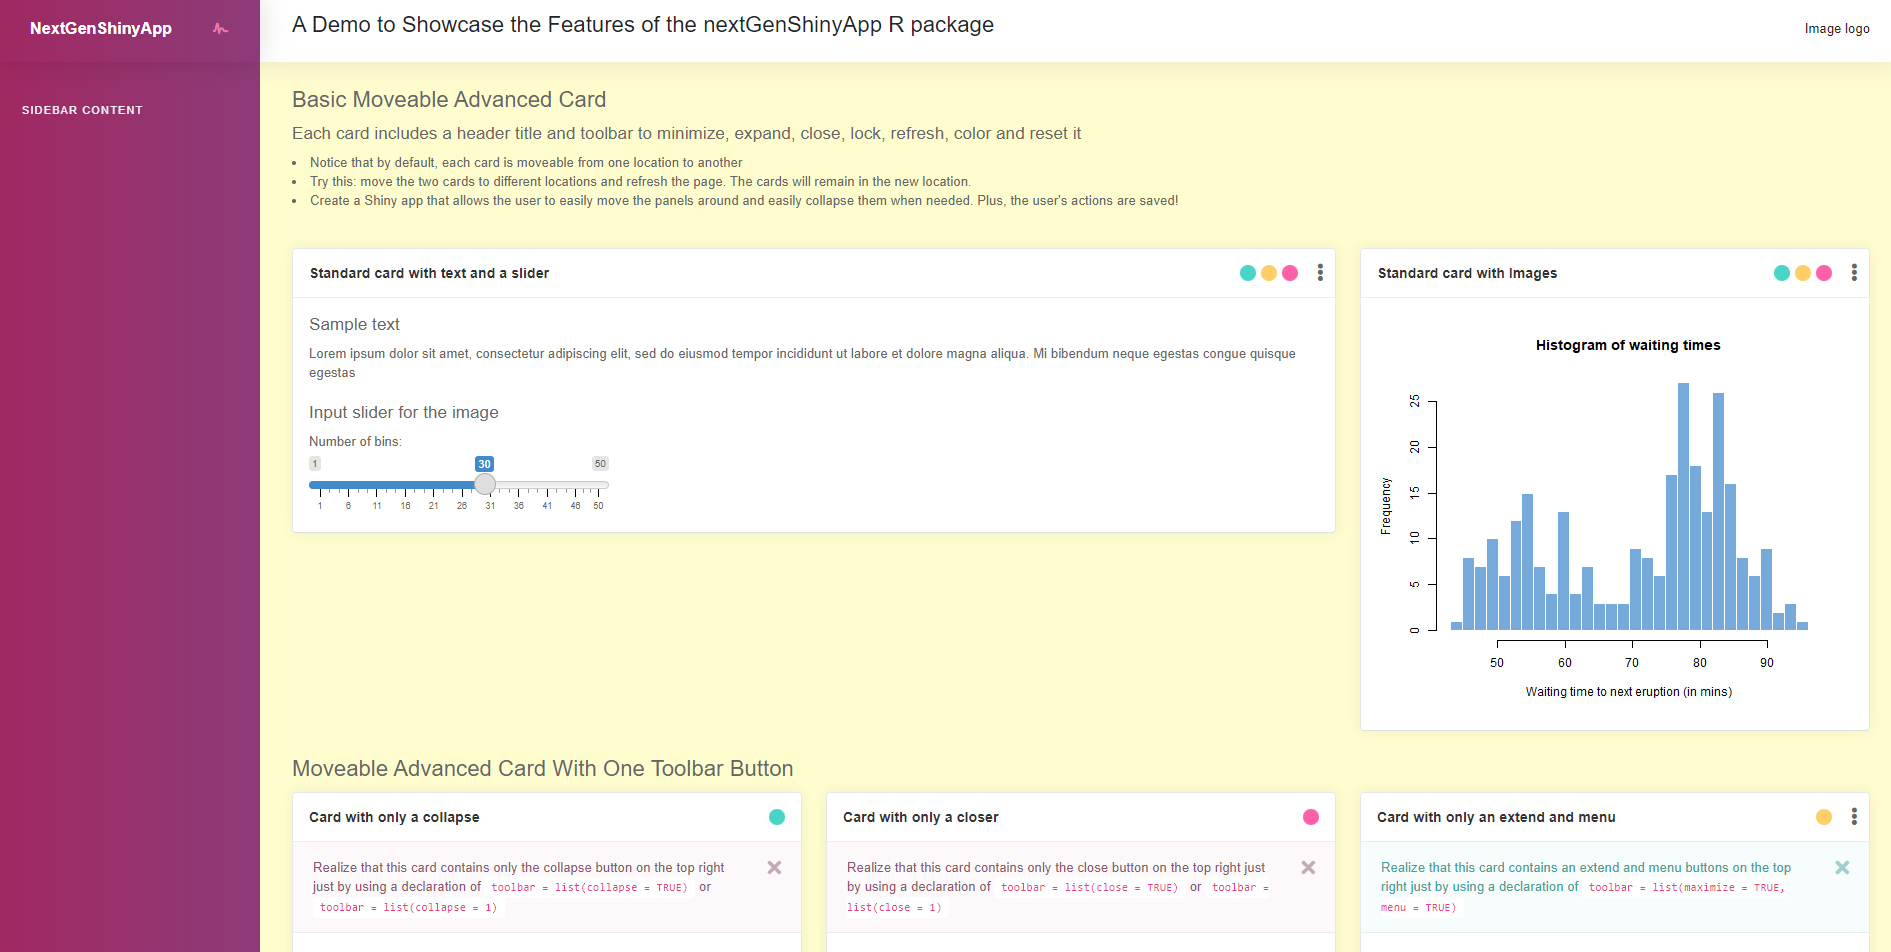
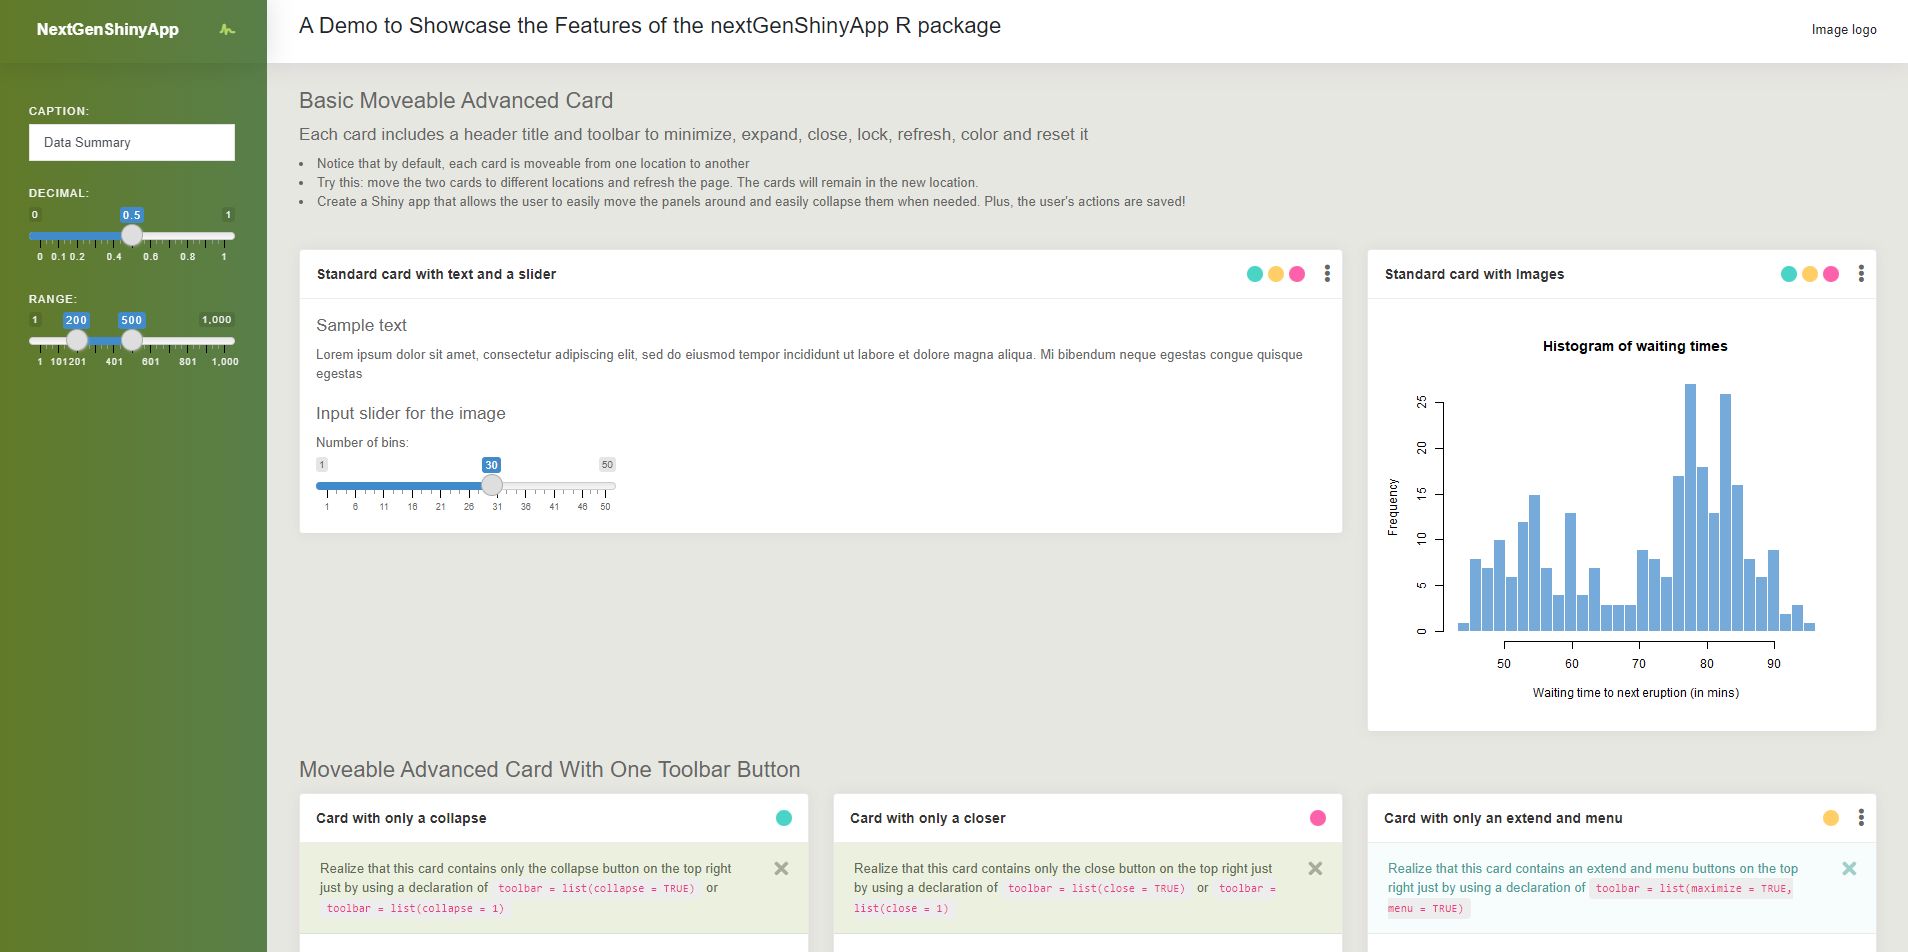
header = titlePanel(left = "Showcase the Features of the nextGenShinyApp R package", right = "Image logo"),
# Sidebar: Insert content for sidebar --
sidebar = sidebarPanel(
title = "NextGenShinyApp",
# sample inputs
textInput(
inputId = "caption",
label = "Caption:",
value = "Data Summary"
)
),
# Body: Insert anything into the body-------
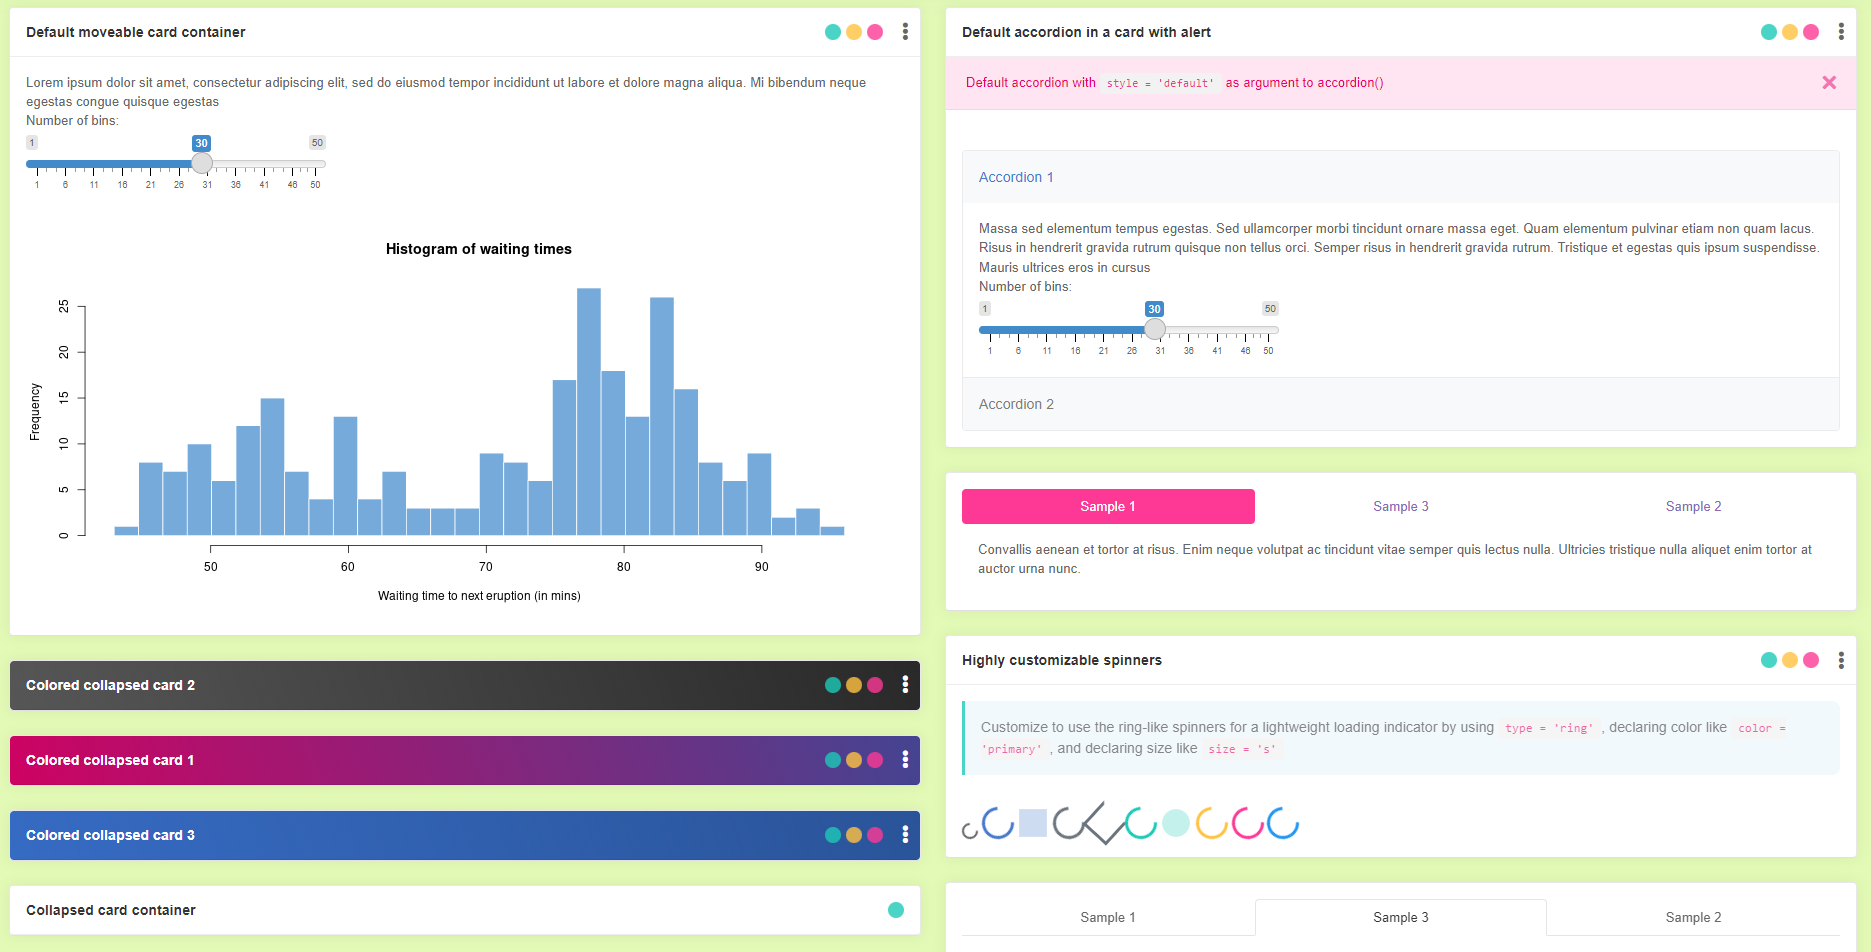
tags$h2("Basic Moveable Advanced Card"),
wrapper(
altPanel(
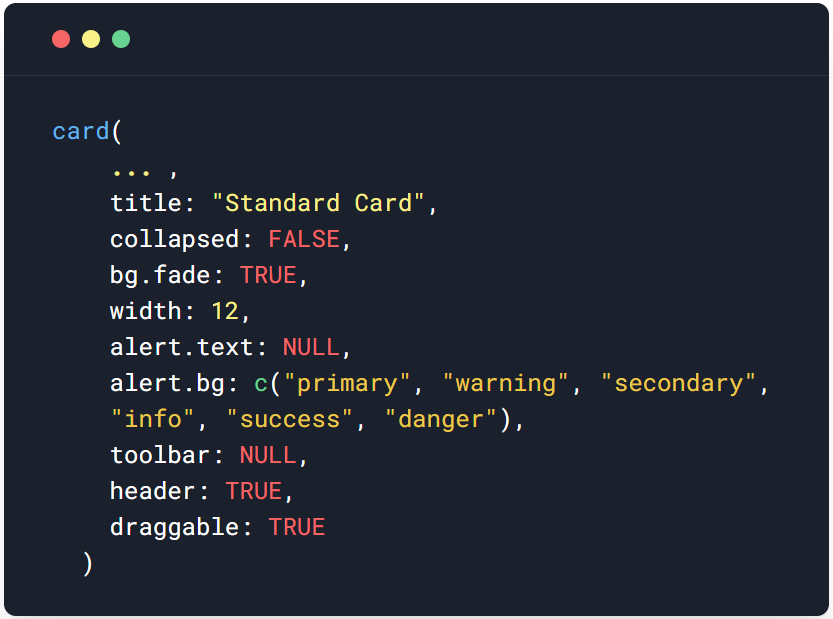
card(
title = "Standard card with text and a slider",
# card body content
sliderInput("bins", "Decimal:",
min = 0, max = 100,
value = 23, step = 0.1
)
)
),
mainPanel(
card(
title = "Standard card with Images",
plotOutput(outputId = "distPlot")
)
)
)
)
# Define server content
server <- function(input, output) {
# Sample user-defined sever logic
output$distPlot <- renderPlot({
x <- faithful$waiting
bins <- seq(min(x), max(x), length.out = input$bins + 1)
hist(x,
breaks = bins, col = "#75AADB", border = "white",
xlab = "Waiting time to next eruption (in mins)",
main = "Histogram of waiting times"
)
})
}
# Create and initialize the Shiny application
shinyApp(ui, server)- load.example("Card")
- load.example("Plain")
- load.example("noSideBar")
- load.example("Tab")
- load.example("Modal")
- load.example("Alert")
- load.example("Accordion")
- load.example("Plotly")
- load.example("Rhansometable")
Check R CRAN link for vignettes