CalTRACK Issue: Calculate Degree Days using Degree Hours when available #120
Comments
|
We might want to quantify the impact on weather station data sufficiency as another acceptance criteria. |
|
Attempting to capture some discussion on this issue during the working group meeting:
Perhaps confirming Jon's point: as noted in #121 we have seen abnormally low balance point temperatures from CalTRACK; perhaps this issue is a cause. Hopefully test results would show improvements in CVRMSE values if a more accurate balance point temperature is selected? |
|
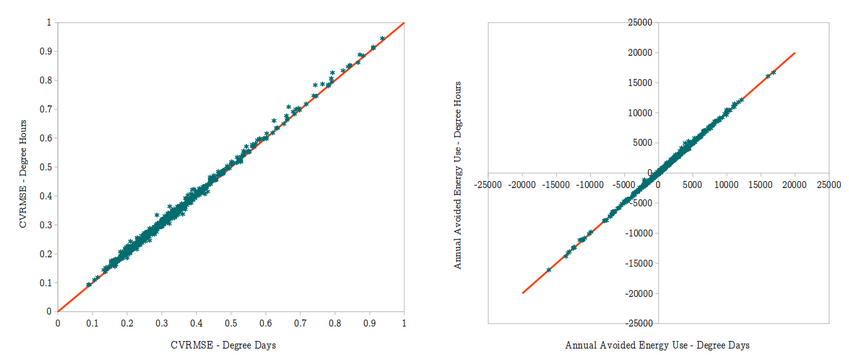
Sharing some preliminary testing results and recommendations: Dataset: Two years of AMI data from a sample of 650 residential buildings in northern California that participated in a Home Performance program. Test procedure: Consumption data was upsampled to daily frequency. The default Caltrack 2.0 daily methods were then applied to the dataset. A second set of CalTRACK models was also fit to the data but modifying 3.3.4 and 3.3.5 to use the average degree-hours over the course of a day rather than the degree days based on average daily temperature. Results:
Recommendations:
|


|
Wonderful analysis Hassan. Thank you for volunteering and doing such a thorough job. You wrote:
Wuhoo! How soon can this be deployed? :-)
HEA would second this recommendation. Jon, pending discussion of course, could we vote tomorrow whether to formally submit it to the Steering committee for review? |
|
We can discuss today at the meeting. @hshaban , did you investigate bias in this data set? If CVRMSE didn't change but avoided energy use predictions did, I am assuming the bias of the model changed. |
|
@jkoliner we didn't get a chance to talk about this on the last call. Which bias would you be interested in looking at? the bias of the models themselves (with the training data) is zero because these are linear regressions. I didn't set this test up with out-of-sample data because we only had one year of baseline. Should we sample some test data in the baseline and check on the bias there? I imagine the difference in bias between the two methods would be relatively small (going by the avoided energy use results - around 0.5% of baseline or so?) Let me know what you're thinking |
|
@hshaban Yes, that makes sense to me. 10% holdback per home and predict that. I would calculate bias without normalizing, but I understand in the past it's been calculated with a normalized metric. Ultimately, I understand that it will be a small change, but when our overall calculations for avoided energy use change, I'd like to know whether we've gotten more biased (artificially generous) or less (correctly less stingy). @mcgeeyoung might dispute whether that's knowable, but let's take a stab at it. |
|
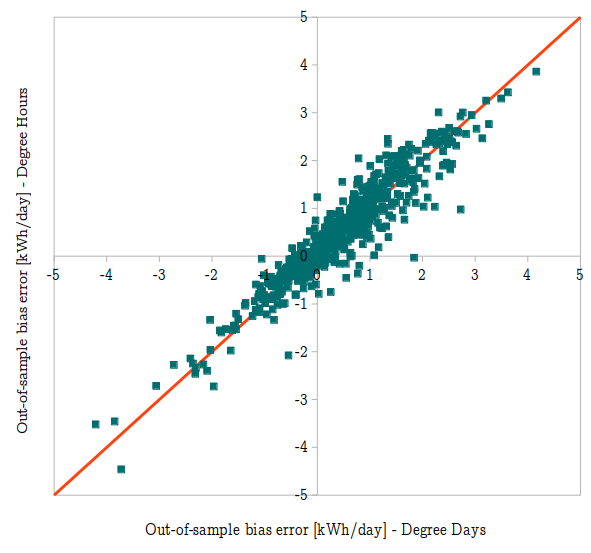
Some out-of-sample results using the same dataset as above (with 20% holdback): The absolute bias using degree hours averaged +0.528 kWh/day compared to +0.466 kWh/day using degree days - so the difference over a year would be about 22 kWh. It's a pretty small number relative to savings and baseline consumption - also it's based on one out-of-sample run, so might be dataset-specific and could benefit from cross-validation. The site-level comparison is also shown below - the absolute value of bias goes up for 53% of homes in this sample and goes down for the other 47%. Overall, doesn't seem like a strong enough trend to change any of the recommendations above.
|
|
As requested in yesterday's working group meeting, proposed changes to existing methods (strikethrough for deletions, bold for additions): 3.3.2.5. 𝐻𝐷𝐷𝑝 is the average number of heating degree days per day in period 𝑝, which is a function of the selected balance point temperature, 3.3.2.6. 𝐶𝐷𝐷𝑝 is the average number of cooling degree days per day in period 𝑝, which is a function of the selected balance point temperature, 3.3.4.1. If only daily average temperatures are available, CDD values are calculated as follows: [this entire section is new] [same changes for 3.3.5, with attention paid to reversed order of terms in 3.3.5.2.7] |
|
Based on the acceptance criteria in the original issue post, did this pass? |
|
In my opinion the "significant impact" of this change on model parameters is due to more accurate counting of nonlinear degree days, which make the model more accurately reflect ground truth. But apparently that has nothing to do with CVRMSE, which I proposed as a metric based on discussions with Recurve. I'd prefer if there was some way to measure the accuracy of the new model parameters against some form of ground truth, but that's a different Issue (#122 & #129). Perhaps Recurve can add their thoughts. |
|
Sorry for the late response -- I'm out on leave. Our conclusion from these tests is that the move from daily degree days to hourly degree days would only have an impact in certain geographic locations with large swings in temperature over the course of the day. The impact is relatively small when considering model fit metrics (bias and precision). There is a large impact on model coefficients, with the models appearing to better capture weather-sensitive energy consumption (this is an improvement - especially when evaluating weather-sensitive measures). Given that model fit appears to be largely unaffected, we support this change and @steevschmidt 's recommendations for updated Caltrack language. |
|
Given that Recurve and HEA didn't directly address my concern, I will be a little more explicit. The acceptance criteria, defined in the original issue, stated that "Monthly bias should be reduced in most cases, and never increase." While I see that this is a small change, and that it has some favorable features (better fitting to weather-sensitive portion of the data), I would like to note that it failed our test criteria. According to out-of-sample testing:
In my opinion, we should test this change on a different data set and assess whether the bias is consistently upward for all data sets, but I understand there is some momentum behind voting. Instead, I am going to surmise why the model metrics degraded, and we can think about how to deal with that later. |
|
As purely a point of process, in strikes me as important to the integrity of the CalTRACK methods that we establish our acceptance criteria for changes upfront and then respect them when the test results come in. If I'm following this thread correctly, my impression is that the proposal is to substitute a post-hoc acceptance criterion of impact on payable savings in lieu of the criteria that were originally proposed. Can someone assure me that this isn't what's going on? Alternatively, come someone help me understand why it should be ok? |
|
@BruceMast I think Recurve's position is that this alleviates a known issue with fitting to the weather-sensitive portion of usage, and that is the post-hoc acceptance criterion they are applying. I believe the argument is that this is permissible because the (bad) changes to CVRMSE and bias are small. |
|
I think this would make a good topic for the next CalTRACK meeting in general - how should acceptance criteria be worded and applied. |
|
HEA objects to this assumption:
We have noted in prior comments (some of which have been deleted) our assessment that current methods consistently underreport savings. We believe this enhancement -- which takes advantage of more accurate weather data -- reduces that underreporting. As possible supporting evidence, it appears the magnitude of the change in savings reported by Hassan significantly exceeded the change in bias. |
|
The current recommendation is to recommend migration to the degree hour method, as specified by Steve above, to the Steering Committee. If a member for the working group disagrees, they should log their dissent in a comment below. |
|
As requested, Hassan and I summarized the issue for the Steering Committee in this 3 page document: |
|
Closing stale issue in preparation for new working group |
Prerequisites
Article reference number in CalTRACK documentation (optional): Unsure; maybe 3.2.1?
(Also, see original issue #94, closed during CalTRACK transition from OEE to EM2.)
Description
Background: In regions with large temperature fluctuations during the day (like the SF Bay Area) residential buildings can have significant HVAC energy use during days when the average daily temperature would indicate none should be required. For example, evening and nighttime temperatures can drop well below 60F on days with average temperatures of 65F or higher. Many homes will run their furnace on nights like these. For this reason it is more accurate to calculate HDDs on an hourly basis whenever possible, instead of using average daily temperatures, as this method will identify actual degree days that would otherwise be ignored.
Issue: Current CalTRACK methods calculate degree days (DDs) using the same periodicity as the energy data. In the case of natural gas, this means that daily gas data is matched with daily average temperatures for PG&E homes in the SF Bay Area, whereas hourly electric data is matched with more accurate hourly temperatures. Because of the nonlinearity of DDs, it is more accurate to always use hourly temperature data whenever hourly data is available; otherwise DDs in regions with high daily temperature variations will be systemically underreported, resulting in poor-fit models.
Validation: A reasonable heating balance point temperature is 65F. The attached example shows hourly temperature variation for a day with an average temperature of 65F. This example Hourly vs Daily HDD.xlsx demonstrates how using daily average temperatures will underestimate degree days: the day's average temperature results in 0 HDD65s, whereas the hourly data results in 2.4 HDD65s, a meaningful difference even for one day. This type of model error is indicated in the chart below as type 1: an energy data point used during the regression analysis will be moved on the temperature axis as the number of degree days is made more accurate.

The non-linear and non-negative aspect of degree days makes this a systemic one-way error; i.e. data point shifts in one direction are not offset by a similar number of shifts in the other direction. And if this type of hourly weather variation occurs year-round, the impact on the regression results can be significant.
Requested CalTRACK change: For Daily methods, calculate DDs using hourly weather data and DHs whenever it is available. Implementation should be trivial, since the code and data for handling hourly temperate data already exists and is in use for hourly smart meter data.
Proposed test methodology
[I could use some help here...]
Acceptance Criteria
Monthly bias should be reduced in most cases, and never increase.
The text was updated successfully, but these errors were encountered: