Example implementation of the network heat maps API and data format using Mapbox GL
This project provides an example of how the heatmap data standard in its JSON serialisation format can be used with an open source mapping library to display the data geographically.
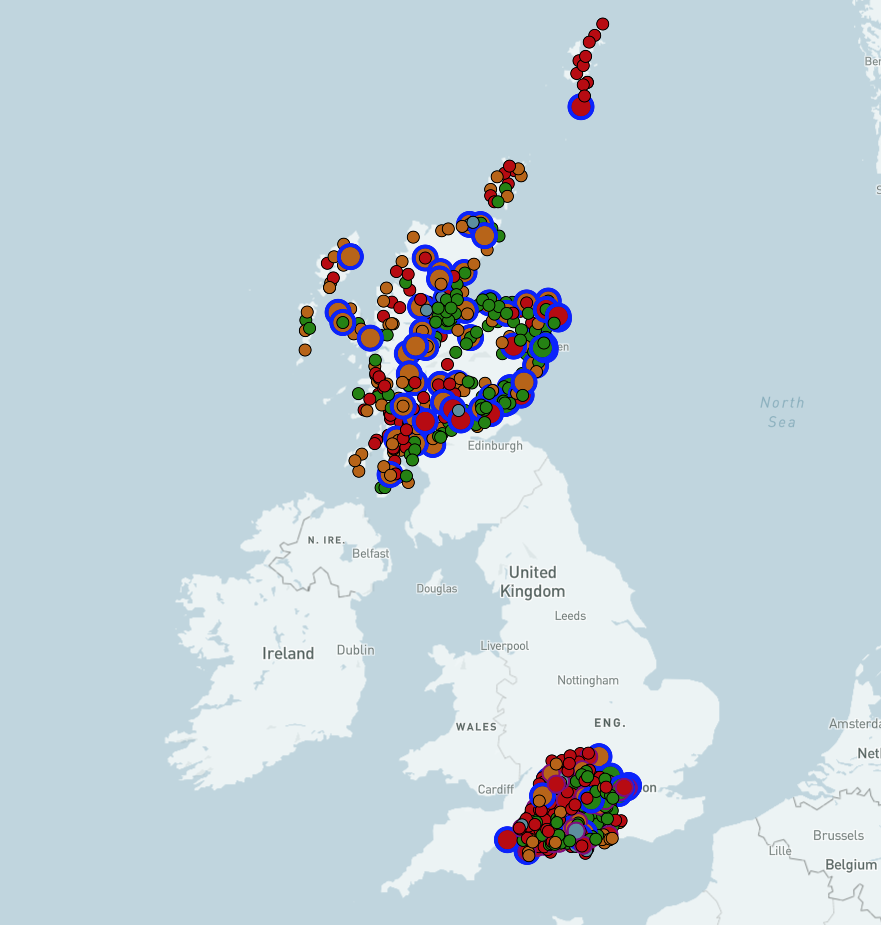
The Javascript code is inline within the index.html file, and uses the Mapbox GL API and JQuery to pull, parse, process, and render the data. This example code provides a simple tabular display of the properties of each substation and circuit.
The rendering is data-driven, using the type of substation (Grid Supply Point - GSP, Bulk Supply Point - BSP, or Primary) to determine the size of the icon, and the colouring is based on the available generation capacity.
The data used is derived from public data sets from SSEN converted into the network heatmap data structure and serialised as JSON.
For more information about the purpose, code, and data used see the main page