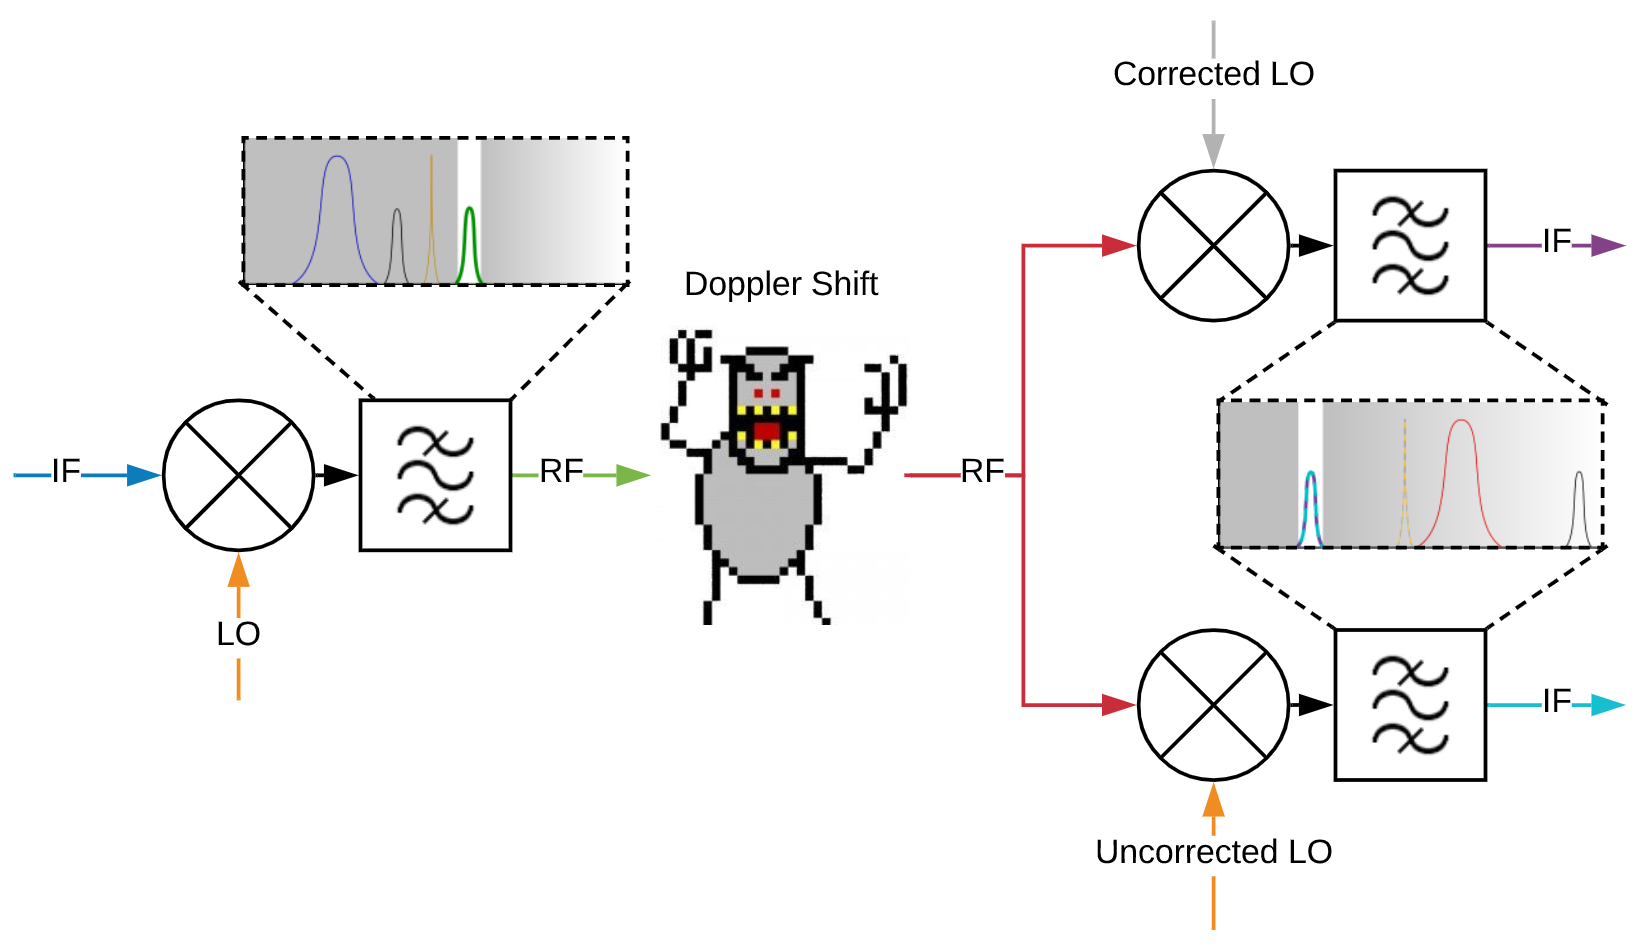
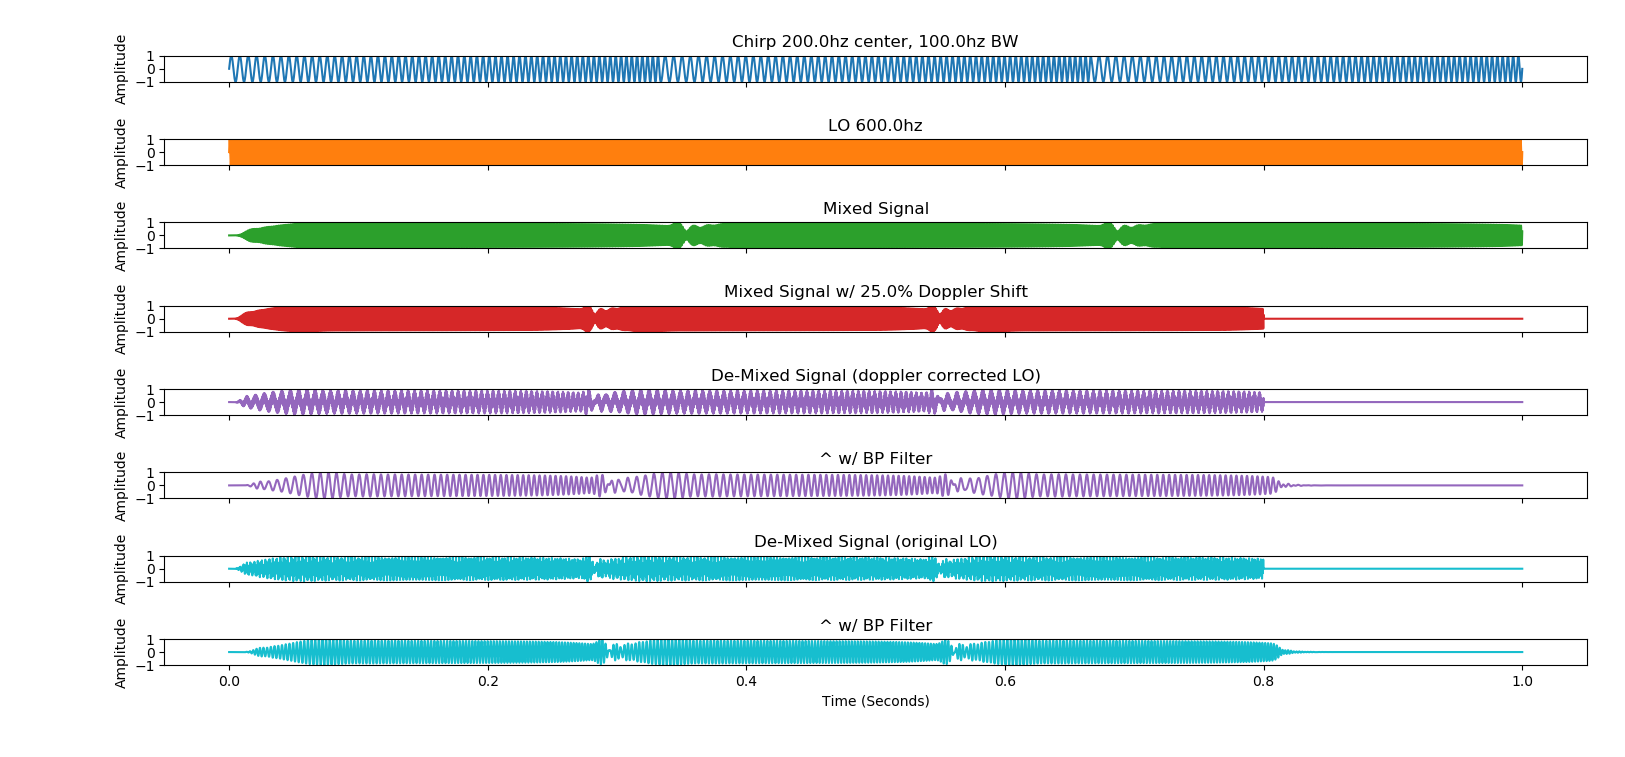
A super low fidelity time simulation of a chirp signal and doppler shifting. This tool was originally to help me (Aaron) gain a better understanding of signal mixing, by showing what a significant bandwidth signal (chirp) looks like:
- When upconverted...
- aka mixed, and band-pass filtered for fLO+fIF
- When doppler shifted
- When downconverted...
- aka mixed with an LO that's corrected and uncorrected for the doppler shift/distortion, and band-pass filtered for fRF-fLO
The following is a color-coded diagram of what the script simulates, corresponding to
the outputs below.
- Python 3.x
- Numpy
- Matplotlib
- Scipy
Clone this repository:
git clone git@github.com:openlunar/chirpsim.git
cd chirpsim/
pip install -r requirements.txt
Currently, this tool cannot be installed as a package. You must run it out of the repository directory.
Navigate to the repo's root folder, and run chirpsim.py with arguments:
cd chirpsim/
python chirpsim.py
Or with arguments as desired:
python chirpsim.py [-h] [-t T_MAX] [-s SIZE] [-d DOPPLER] [-bw BW]
                   [-fc F_CENTER] [-fr F_RATE] [-lf LO_F] [-lp PHASE]
Or for help, do the usual:
python chirpsim.py --help
There are unfortunately quite a few args, but hey, what can you do:
optional arguments:
  -h, --help            show this help message and exit
  -t T_MAX, --t-maxx T_MAX
                        total simulation time, in seconds
  -s SIZE, --time-steps SIZE
                        number of timesteps
  -d DOPPLER, --doppler DOPPLER
                        amount of doppler shifting to apply to the chirp
                        signal, in percent

chirp_chars:
  chirp signal characteristics

  -bw BW, --bandwidth BW
                        bandwidth of the chirp signal, in hz
  -fc F_CENTER, --center-frequency F_CENTER
                        center frequency of the chirp signal, in hz
  -fr F_RATE, --frequency-rate F_RATE
                        rate that the chirp spans its bandwidth, in hz/s

lo_chars:
  lo signal characteristics

  -lf LO_F, --lo-frequency LO_F
                        frequency of the lo signal, in hz
  -lp PHASE, --lo-phase PHASE
                        phase shift of the demixing lo, from the mixing lo, in
                        deg
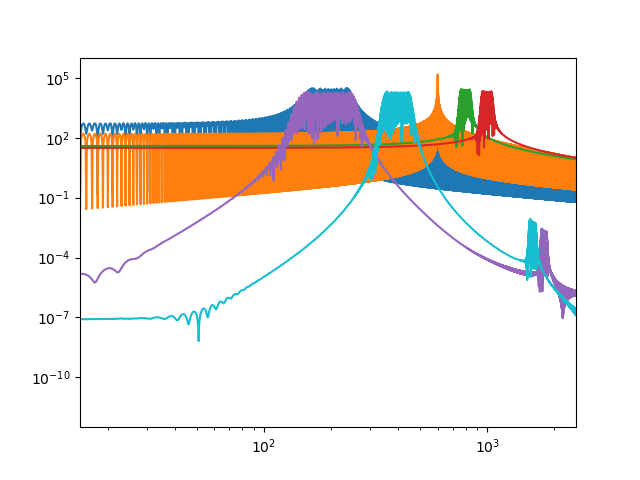
The following plots should show up, which are both color coded to the overview diagram above.
A plot of the time domain:
A plot of the frequency domain: