MedFM Dataset: Real-world Dataset and Benchmark For Foundation Model Adaptation in Medical Image Classification.
MedFMC encapsulates five representative medical image classification tasks from real-world clinical daily routines. Fig. 1 presents sample images from each subset, and Table and Figure below show the summary of data, including modality, number of samples, image size, classification tasks, and number of classes. Different from many existing public datasets in the medical domain, e.g., Chest X-rays, MSD, and HAM10000, the proposed dataset and benchmark do not target advancing and evaluating the performance of each individual task with the conventional full-supervised training paradigm, which may require larger amount of data individually. Instead, we believe that this new dataset (as a union) provides valuable support to develop and evaluate generalizable solutions of adapting foundation models to a variety of medical downstream applications, e.g., using few samples as the prompts and the rest as testing standardly across all five tasks. In this study, we focus on 2D medical image classification as a start and cover the most common 2D medical imaging modalities. 3D data and other tasks, e.g., detection and segmentation, will be expanded and investigated in future work.


It is also provided for Foundation Model Prompting for Medical Image Classification Challenge 2023 (MedFM).
-
The MedFM dataset is in conjunction with the MedFM challenge, which aims at revealing the power of foundation models to ease the effort of obtaining quality annotations and target improving the classification accuracy of tail classes. It aims to advance technique in prompting large-scale pre-trained foundation models via a few data samples as a new paradigm for medical image analysis, e.g., classification tasks proposed here as use cases.
-
In the challenge setting, a small amount of our private data would be utilized for the initial training (selected few samples) and validation (the rest of the dataset). Participants are encouraged to achieve higher performance scores in three detailed application tasks, i.e., one with radiological images-thoracic disease screening, one with pathological ones - pathological tumor tissue classification, and one with natural images - lesion classification in colonoscopy images.
-
The final evaluation will be conducted in the same setting on the reserved private datasets, i.e., the random selection of a few samples for the training and the rest for the testing. The final metrics will be averaged over 5 individual runs of the same prompting/testing process.
We collect five sets of medical imaging data from multiple institutes targeting a variety of real-worldclinical tasks (22,349 images in total), i.e., thoracic diseases screening in X-rays, pathological lesion tissue screening, lesiondetection in endoscopy images, neonatal jaundice evaluation, and diabetic retinopathy grading
Specifically, ChestDR, Colon and Endo are in conjunction with the NeurIPS 2023 Challenge.
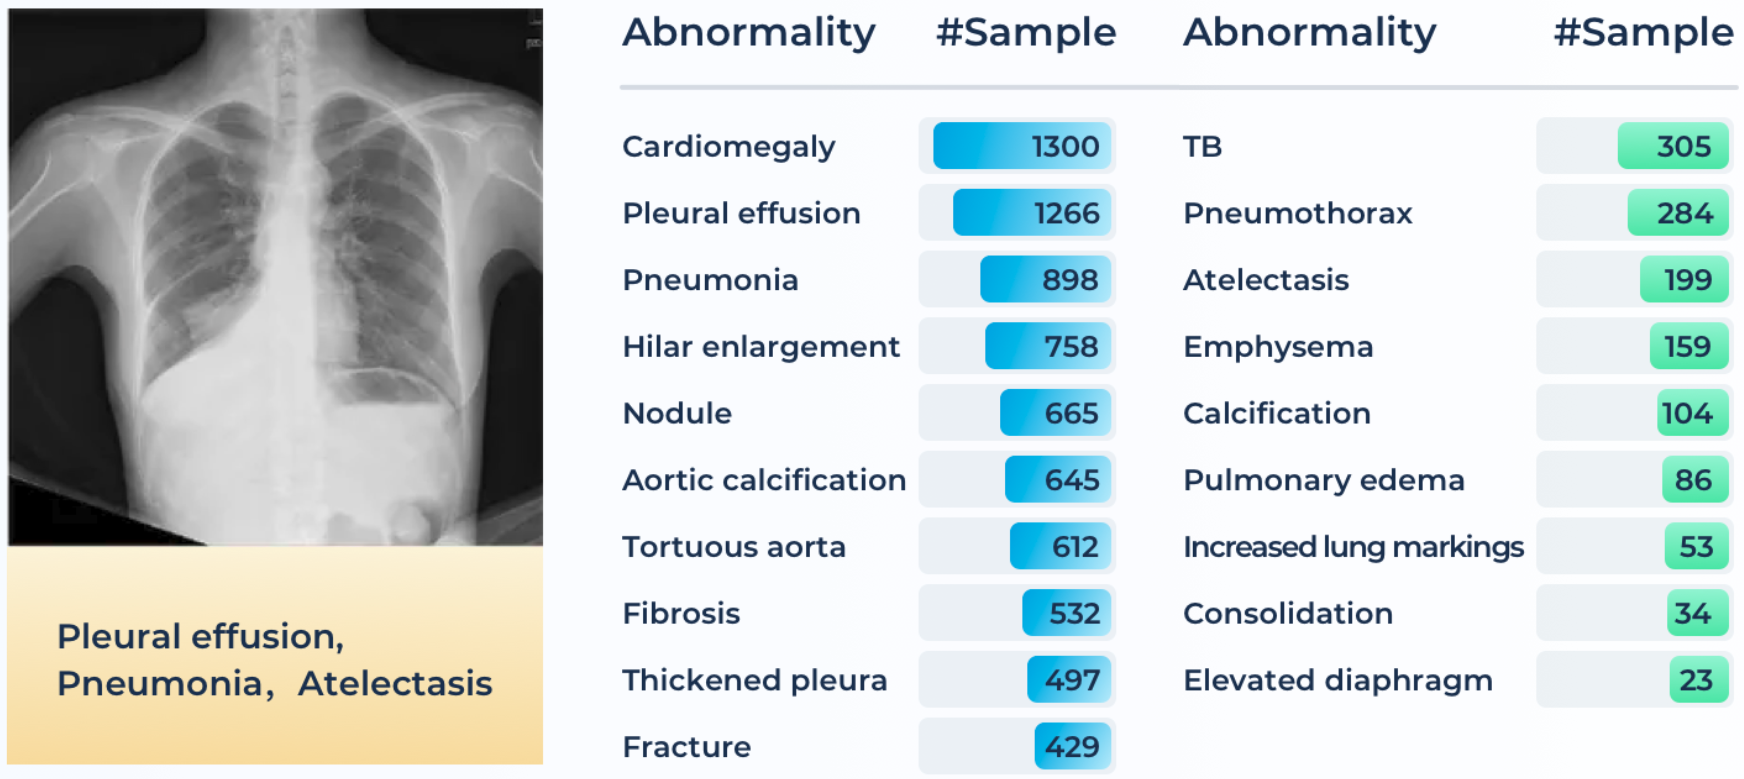
Chest X-ray is a regularly adopted imaging technique for daily clinical routine. Many thoracic diseases are reported, and further examinations are recommended for differential diagnoses. Due to the large amount and fast reporting requirements in certain emergency facilities, a swift screening and reporting of common thoracic diseases could largely improve the efficiency of the medical process. Although there are a few chest x-ray datasets (e.g., ChestX-ray14, Chexpert, MIMIC-CXR) now publicly accessible, images with quality annotations (preferably verified by radiologists) are still a scarce resource for training and evaluating modern machine learning-based models.
A total of 4,848 patients’ 4,848 frontal radiography images are provided in ChestDR. A detailed distribution of 19 common thoracic diseases is presented in Figure below, which is sorted with the number of samples. Tail classes are highlighted in Red. Each PNG image is converted from the original DICOM files using the default window level and width (stored in the DICOM tags). The original image sizes are preserved. The initial disease labels are provided by a radiological resident (with the support of previously signed radiology reports) and then confirmed by a senior radiologist.
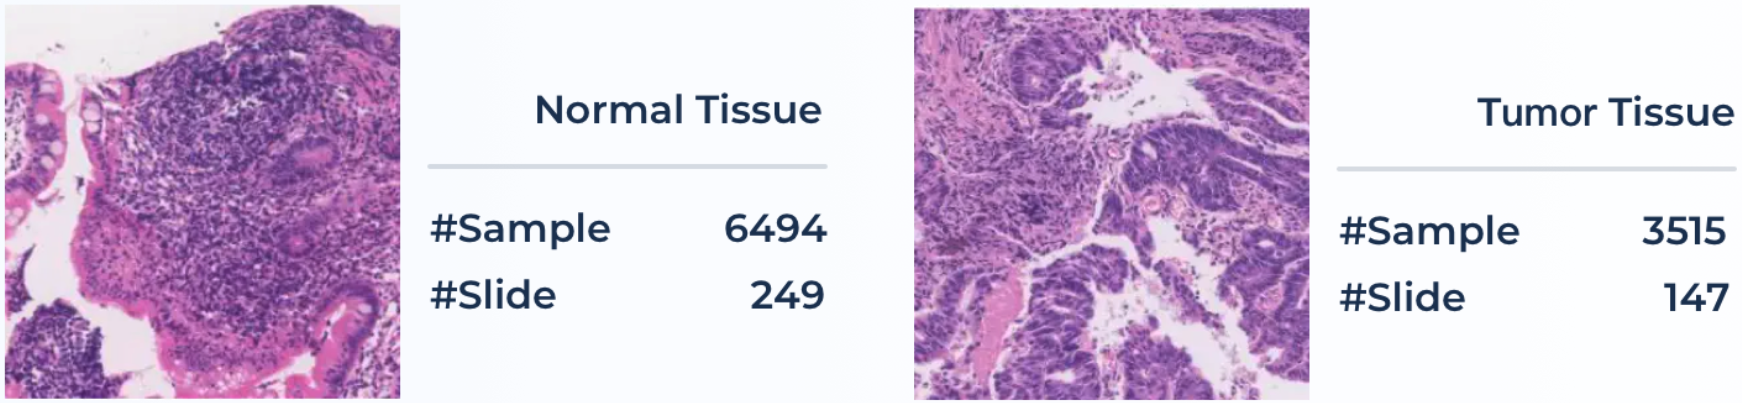
Pathology examination can support detecting early-stage cancer cells in small tissue slices. In the pathologist's daily routine, they are required to look over several dozens of tissue slides, a tiresome and tedious job. In clinical diagnosis, quantifying cancer cells and regions is the primary goal for pathologists. The approaches for the classification of pathological tissue patches are desired to ease this process and help screen whether it exists regions of malignant cells in the entire slide in a sliding window manner.
Pathology slides are collected from Ruijin Hospital, China. All slides were acquired from 2017–2019 with hematoxylin and eosin (HE) stains and scanned using the KF- BIO FK-Pro-120 slide scanner. After slide scanning, the WSIs were subsequently re-scaled to ×20 magnification with a pixel resolution of 0.475 µm. A total of 396 patients’ 10,009 large tissue patches (with a uniform size of 1024×1024 ) of colonoscopy pathology examination will be available in ColonPath. Positive and negative patch samples (with and without the tumor tissue) are illustrated in Figure below along with the number of samples in each category. Tissue patches are extracted from the WSI in a sliding window fashion with a fixed size of 1024×1024 and a stride of 768. The initial labels (whether containing tumor tissues) are provided by a trainee in the pathology specialty (with the support of previously signed reports) and then confirmed by a senior pathologist.
Jaundice commonly occurs in newborn infants. However, most jaundice is benign and does not require any interference. Conventionally, newborns must be monitored by taking a blood test to examine the bilirubin level. The potential toxicity of bilirubin might lead to severe hyperbilirubinemia and, in rare cases, acute bilirubin encephalopathy or kernicterus. Recent techniques utilized demographic images of three different parts of the infants, i.e., head, face, and chest, to estimate the total serum bilirubin in the blood so as to avoid the repeated invasive blood test for infants.
A total of 745 infants’ 2,235 images (with an average size of 567×567 ) are collected in the NeoJaundice dataset from the Xuzhou central hospital. The initial binary labels are generated using the total serum bilirubin readings extracted from the hospital's health information system with a threshold of 12.9mg/dL and then confirmed by a senior experienced pediatrician. Samples of both low and high bilirubin levels are illustrated in Figure below along with the number of samples in each category. Three images are acquired for each infant on body skins of the head, face, and chest, using digital cameras. The skin regions are surrounded by a standardized color card for color calibration purposes.

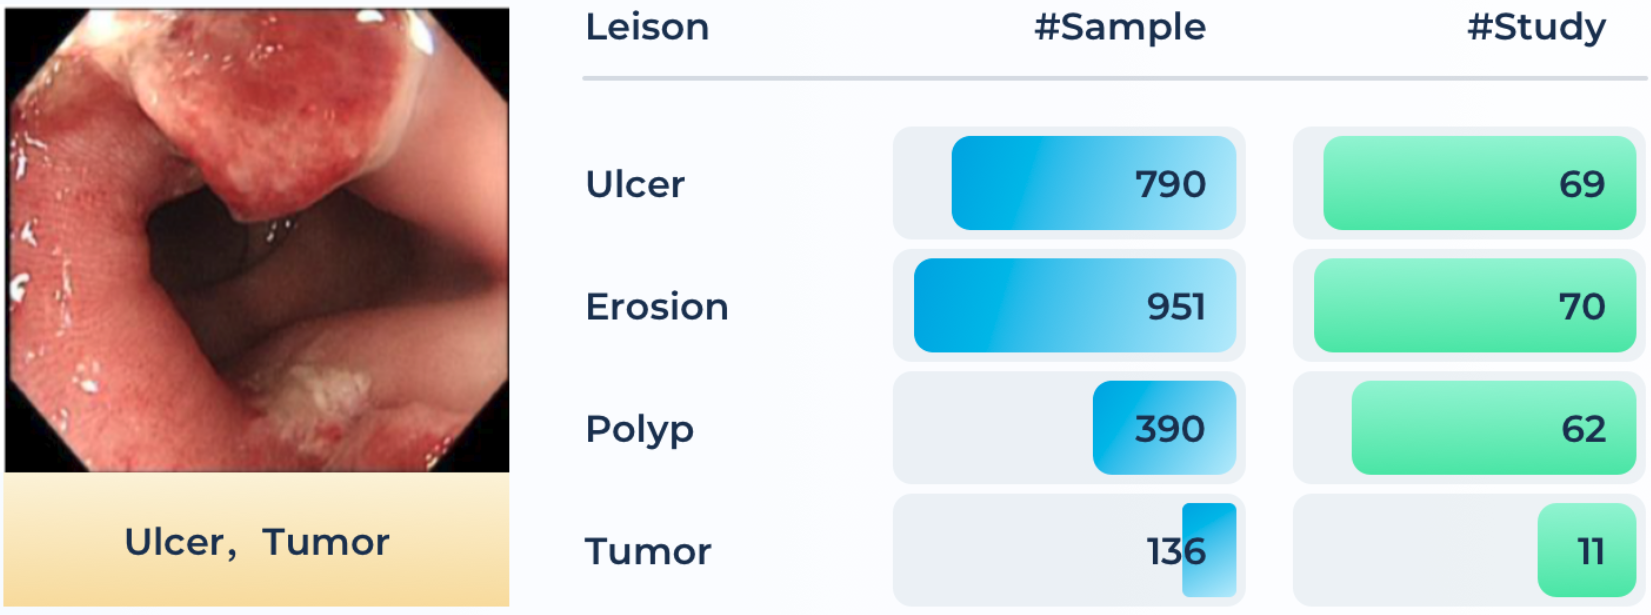
Colorectal cancer is one of the most common and fatal cancers among men and women around the world. Abnormalities like polyps and ulcers are precursors to colorectal cancer and are often found in colonoscopy screening of people aged above 50. The risks largely increase along with aging. Colonoscopy is the gold standard for the detection and early diagnosis of such abnormalities with necessary biopsy on site, which could significantly affect the survival rate from colorectal cancer. Automatic detection of such lesions during the colonoscopy procedure could prevent missing lesions and ease the workload of gastroenterologists in colonoscopy.
A total of 80 patients’ 3,865 images (with an average size of 1280×1024 ) recorded during the colonoscopy examination on the workstations in Renji Hospital are produced in the Endo dataset. Four types of lesions, i.e., ulcer, erosion, polyp, and tumor are included, which are illustrated in Figure below along with the number of samples in each category. Non-relevant images are already excluded, while some noisy and degraded recordings remain to reflect the real-world data distribution. The initial labels of lesions are performed by a junior gastroenterologist (with the support of health records and reports) and then confirmed by a senior experienced gastroenterologist.
Diabetic retinopathy (DR) can lead to vision loss and blindness in patients with diabetes, mainly affecting the blood vessel in the retina. Therefore, it is important to have an exam of the retina each year for the early detection of DR. Currently, DR grading requires a trained ophthalmologist to manually evaluate color fundus photos of the retina, which is time-consuming and may delay the treatment of patients. Automated screening of DR has long been recognized and desired.
A total of 1,392 patients’ 1392 fundus images (with an average size of 2736×1824 ) are included in the Retino dataset, which is extracted from the retinal imaging workstations after the examination. Samples of retina images in each of the five grades are illustrated in Figure below along with the number of samples in each grade. An experienced ophthalmologist rated the presence of diabetic retinopathy in each image on a scale of 0 to 4, i.e., 0: No DR; 1: Mild; 2: Moderate; 3: Severe; 4: Proliferative DR. It may contain noise in both the images and labels, e.g., images may have artefacts.

-
The MedFMC (NeurIPS 2023 Challenge) dataset could be downloaded from Grand Challenge.
-
The full MedFM dataset could be dowloaded from OpenDataLab.
The related official code is available here.
To evaluate the performance of experimental results, we compute the overall accuracy (Acc) and area under the receiver operating characteristic curve (AUC) for the multi-class classification tasks in the datasets of ColonPath, NeoJaundice and Retino, and we compute the mean average precision (mAP) and AUC for the multi-label classification tasks in the datasets of ChestDR and Endo. In the MedFM Challenge, the averaged result of all Acc, mAP and AUC would be final evaluation metric in ranking (see below).
Accuracy reflects the overall correct predictions among all the test images. The predicted label is determined with the maximum softmax outputs in the multi-class classification task. AUC is computed for each class to measure the capability of distinguishing between positive and negative classes at various threshold settings. The AP is the weighted average of precisions, while the mAP for all samples is the mean value of the AP scores for each class.
In the experiment, we employ two few-shot baseline methods, i.e., Meta-Baseline and Visual Prompt Tuning (VPT).
The results are shown as below:

We run the fine-tuning experiments using three representative networks, including DenseNet, EfficientNet, and Swin Trans-former, on the five medical image datasets.

This project is released under the Apache 2.0 license.
@article{wang2023medfmc,
  title={MedFMC: A Real-world Dataset and Benchmark For Foundation Model Adaptation in Medical Image Classification},
  author={Wang, Dequan and Wang, Xiaosong and Wang, Lilong and Li, Mengzhang and Da, Qian and Liu, Xiaoqiang and Gao, Xiangyu and Shen, Jun and He, Junjun and Shen, Tian and others},
  journal={arXiv preprint arXiv:2306.09579},
  year={2023}
}