Skip to content
New issue

Have a question about this project? Sign up for a free GitHub account to open an issue and contact its maintainers and the community.

By clicking “Sign up for GitHub”, you agree to our terms of service and privacy statement. We’ll occasionally send you account related emails.

Already on GitHub? Sign in to your account

Investigate slow OpenCL performance on AMD #3937

Open
peastman opened this issue Jan 31, 2023 · 105 comments
Open

Investigate slow OpenCL performance on AMD #3937

peastman opened this issue Jan 31, 2023 · 105 comments

Comments

@peastman
Copy link
Member

This is to continue the discussion that started in #3934. On AMD GPUs, the OpenCL platform is sometimes several times slower than the HIP platform. We're trying to figure out why. Much of the slowness seems to be due to large gaps between kernels where the GPU is sitting idle.

@peastman
Copy link
Member Author

integrateLangevinMiddlePart3 -> calcCenterOfMassMomentum

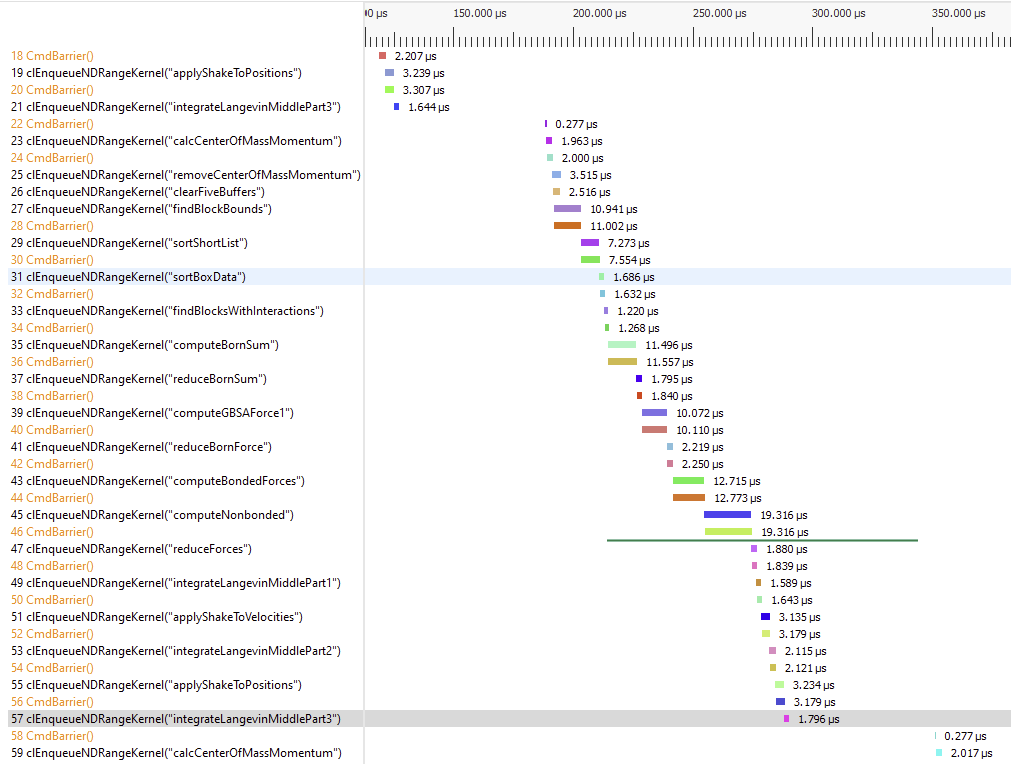
That's a mystery. There shouldn't be anything happening in between. No data transfer, no synchronization. We just launch one kernel, then launch the other.

findBlocksWithInteractions -> computeBornSum

In between those we do an enqueueReadBuffer() to transfer data back to the host. It's specified as non-blocking, and we don't wait on the event until much later, after computeNonbonded has finished. But perhaps it's somehow making it a blocking call instead?

computeNonbonded -> reduceForces

This is where we wait on that event. But that doesn't make sense as the explanation. We already had one long pause, and transferring a few bytes from device to host shouldn't take hundreds of microseconds.

@philipturner
Copy link
Contributor

There is one way to quickly test the theory. Perform multiple instances of the simulation in parallel, utilizing multiple CPU cores. I hypothesize that running two simulations will double the throughput in units of simulation*ns/day.

@peastman I suspect this is harming performance on GPUs besides AMD. You or I could test the hypothesis on an M1 GPU.

@peastman
Copy link
Member Author

It's clear that the gaps are hurting performance. The question is, what causes them?

@philipturner
Copy link
Contributor

How about we narrow down the problem? For example, remove one of the kernels that isn't causing a gap. See whether the gap persists. Repeat the procedure, you get the idea. This will narrow down and validate that, in isolation, e.g. computeNonbonded and reduceForces will always have a massive gap. You could also start with the final two ab initio, but I hypothesize the gap won't happen.

@bdenhollander
Copy link
Contributor

I commented out the enqueueReadBuffer and the code that relied on it. Performance is through the roof on gbsa, 410 ns/day -> 3030 ns/day!

void OpenCLNonbondedUtilities::computeInteractions(int forceGroups, bool includeForces, bool includeEnergy) {
...
  //downloadCountEvent.wait()
  //updateNeighborListSize();
}

The gap between computeNonbonded and reduceForces is eliminated. I drew a green line where it would normally be.

image

@bdenhollander
Copy link
Contributor

integrateLangevinMiddlePart3 has this little gem:

void CommonIntegrateLangevinMiddleStepKernel::execute(ContextImpl& context, const LangevinMiddleIntegrator& integrator) {
...
// Reduce UI lag.
    
#ifdef WIN32
    cc.flushQueue();
#endif
}

Commenting out cc.flushQueue(); eliminates the integrateLangevinMiddlePart3 -> calcCenterOfMassMomentum gap but doesn't have much impact on performance. It is the shortest of the 3 gaps.
image

@philipturner
Copy link
Contributor

I commented out the enqueueReadBuffer and the code that relied on it. Performance is through the roof on gbsa, 410 ns/day -> 3030 ns/day!

You commented out the part that rebuilds nearest neighbor lists, so this is misleading.

@peastman
Copy link
Member Author

I commented out the enqueueReadBuffer and the code that relied on it. Performance is through the roof on gbsa, 410 ns/day -> 3030 ns/day!

Sadly, I don't think that's real. It just means you broke it!

We don't know in advance how much memory we'll need for the neighbor list. We pick an amount that we hope will be enough, but often isn't. Since the GBSA benchmark uses a larger cutoff than the others, it isn't.

That's ok. The nonbonded kernel spots that there wasn't enough memory for the neighbor list and returns without doing much. updateNeighborListSize() allocates more memory and marks that the force evaluation was invalid and we need to repeat it. But you removed the call to it. Instead it just keeps running timesteps with the nonbonded kernel always returning early and not computing most of the interactions.

Commenting out cc.flushQueue(); eliminates the integrateLangevinMiddlePart3 -> calcCenterOfMassMomentum gap but doesn't have much impact on performance.

That only happens on Windows. It was added for Folding@home. Previously it had a tendency to load the GPU so heavily that the computer became unresponsive and people couldn't do anything else while it was running. We added the flush to make it break and ensure other processes would have time to run. But only on Windows, since on other platforms it probably isn't running as part of Folding@home.

@philipturner
Copy link
Contributor

I suggested a better way to examine the problem, run two simulations in parallel. This requires a more complex setup than benchmark.py. It's particularly important to my use case because, if we can't resolve the latency issue, I can still extract full throughput.

Benchmarks on M1 Max with the Metal plugin. Some benchmarks show significant underutilization, even with correct SIMD width. Remember that before, apoa1rf was using 13 W.

Benchmark Peak Power Theoretical Limit Theoretical Speedup
gbsa 13.2 W 40-60 W 3.03-4.54x
rf 19.6 W 40-60 W 2.04-3.06x
pme 16.6 W 40-60 W 2.41-3.61x
apoa1rf 30.9 W 40-60 W 1.29-1.94x
apoa1pme 23.5 W 40-60 W 1.70-2.55x
apoa1ljpme 23.2 W 40-60 W 1.72-2.59x
amoebagk 15.2 W 40-60 W 2.63-3.95x
amoebapme 17.1 W 40-60 W 2.34-3.51x
amber20-cellulose 27.4 W 40-60 W 1.46-2.19x
amber20-stmv 27.1 W 40-60 W 1.48-2.21x
Benchmark ns/day Theoretical Limit (Lower) Theoretical Limit (Upper)
gbsa 379.4 1149.6 1722.5
rf 300.2 612.4 918.6
pme 198.2 477.7 715.5
apoa1rf 112.8 145.5 218.8
apoa1pme 66.4 112.9 169.3
apoa1ljpme 49.7 85.5 128.7
amoebagk 1.18 3.10 4.66
amoebapme 3.93 9.20 13.79
amber20-cellulose 14.18 20.70 31.05
amber20-stmv 3.83 5.67 8.46

@bdenhollander
Copy link
Contributor

I know I broke the simulation...but in the process I think I confirmed enqueueReadBuffer and downloadCountEvent.wait() introduce pauses.

@peastman
Copy link
Member Author

peastman commented Feb 1, 2023

The PME benchmark is a better test for this. It never needs to resize the neighbor list, so we can safely remove the related calls and see what difference it makes. Here's what I get. (I finally got my AMD GPU working again!)

Original: 320 ns/day
Download the interaction count, but don't wait on the event: 340 ns/day
Don't download it: 406 ns/day

The download causes about a 25% slowdown, even though it's supposed to happen asynchronously and nothing ever depends on it having completed.

@philipturner
Copy link
Contributor

philipturner commented Feb 1, 2023

gbsa, rf, and amoebapme seem messed up. Elsewhere, there was a minor performance boost. Faster simulations (where latency would impact more) received a greater speedup, indicating it was from not waiting.

Benchmark Before ns/day After ns/day Before Peak W After Peak W
gbsa 379.4 1145.2 13.2 5.2
rf 300.2 silently fails 19.6 silently fails
pme 198.2 243.5 16.6 20.9
apoa1rf 112.8 127.7 30.9 36.4
apoa1pme 66.4 71.9 23.5 26.1
apoa1ljpme 49.7 53.2 23.2 25.6
amoebagk 1.181 1.183 15.2 15.6
amoebapme* 3.97 4.59 17.3 13.1
amber20-cellulose 14.18 14.41 27.4 27.8
amber20-stmv* 3.78 3.77 27.2 27.4

*These were (re-)run for 3 trials because the data seemed strange. Everything else was 1 trial.

Benchmark ns/day Change Power Change (Δ ns/day)/(Δ W)
gbsa 3.02x 0.39x 7.66
rf n/a n/a n/a
pme 1.23x 1.26x 0.98
apoa1rf 1.13x 1.18x 0.96
apoa1pme 1.08x 1.11x 0.97
apoa1ljpme 1.07x 1.10x 0.97
amoebagk 1.00x 1.03x 0.98
amoebapme 1.16x 0.76x 1.53
amber20-cellulose 1.02x 1.01x 1.00
amber20-stmv 1.00x 1.01x 0.99

@bdenhollander
Copy link
Contributor

Original: 320 ns/day
Download the interaction count, but don't wait on the event: 340 ns/day
Don't download it: 406 ns/day

My results are similar:

Original: 300 ns/day
Download the interaction count, but don't wait on the event: 320 ns/day
Don't download it: 444 ns/day

The PME benchmark is a better test for this. It never needs to resize the neighbor list, so we can safely remove the related calls and see what difference it makes.

Can this be known ahead of time in more situations? If so, wrapping the enqueueReadBuffer in an if statement would be a good first step.

@philipturner
Copy link
Contributor

philipturner commented Feb 1, 2023

Can this be known ahead of time in more situations? If so, wrapping the enqueueReadBuffer in an if statement would be a good first step.

Is this also the case in Reaction Field, the primary benchmark I'm measuring progress with?

Can this be known ahead of time in more situations? If so, wrapping the enqueueReadBuffer in an if statement would be a good first step.

Before doing this, we should figure out what's happening with AMOEBA PME.

@peastman
Copy link
Member Author

peastman commented Feb 1, 2023

Unfortunately, it can never be known ahead of time. It also monitors the number of interactions for clues when it should reorder the molecules. That's important for performance in certain situations.

@philipturner
Copy link
Contributor

@egallicc would you mind comparing power consumption to ns/day on HIP like I did, but without erasing downloadCountEvent? Then we can investigate whether HIP reached a genuine 1000 ns/day on RX 6750 XT, by comparing Δns/day to ΔW.

@ex-rzr
Copy link
Contributor

ex-rzr commented Feb 1, 2023

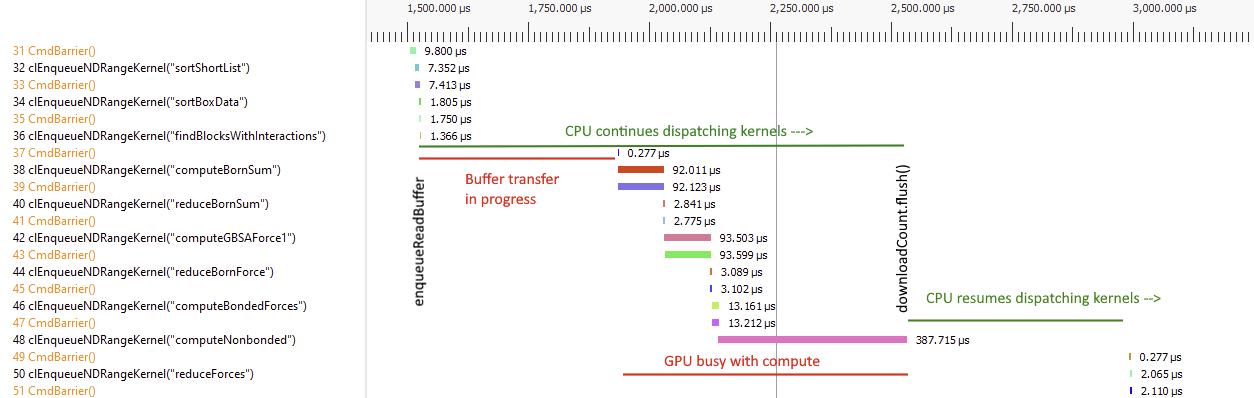
Are you sure that the gap is not caused by interactingTiles.resize and interactingAtoms.resize? Do you see it in other iterations?

@bdenhollander
Copy link
Contributor

The download causes about a 25% slowdown, even though it's supposed to happen asynchronously and nothing ever depends on it having completed.

The C++ call is non-blocking but the GPU still processes the command queue in order. I think the GPU waits for the data transfer to complete before resuming compute on the next kernel.
image

@philipturner
Copy link
Contributor

philipturner commented Feb 1, 2023

Is this the data transfer from GPU -> CPU? Perhaps it's avoidable using indirect command buffers in Metal, HIP, CUDA, OpenCL 2.0. Have the GPU encode any commands depending on the value of pinnedCountMemory and never request it CPU-side.

Also how large is the buffer? It might take significant time over PCIe. If this hypothesis is correct, the gap you highlighted won't appear on M1 Pro. Also we could profile how long it takes the CPU to encode kernels (very expensive).

@ex-rzr
Copy link
Contributor

ex-rzr commented Feb 1, 2023

Also how large is the buffer?

1 uint

What happens if pinnedCountMemory is a regular memory (new or malloc) instead of this?

    pinnedCountBuffer = new cl::Buffer(context.getContext(), CL_MEM_ALLOC_HOST_PTR, sizeof(unsigned int));
    pinnedCountMemory = (unsigned int*) context.getQueue().enqueueMapBuffer(*pinnedCountBuffer, CL_TRUE, CL_MAP_READ, 0, sizeof(int));

@ex-rzr
Copy link
Contributor

ex-rzr commented Feb 1, 2023

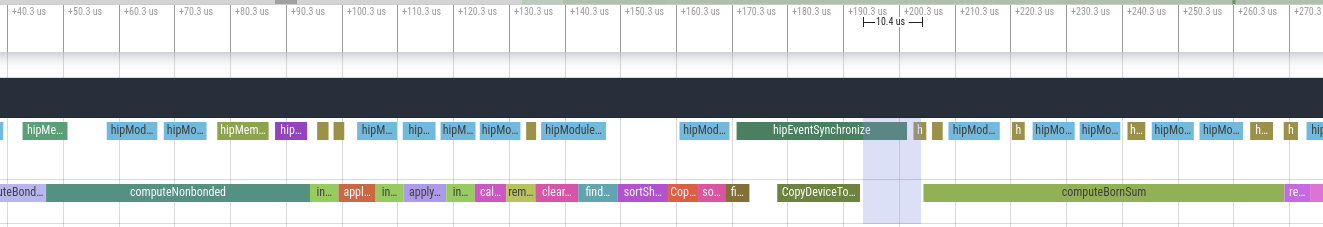
gbsa on HIP, MI210, the gap between findBlocksWithInteractions and computeBornSum is about 30 us (between memcopy and computeBornSum - 10 us)

изображение

Unless it's the first iteration where OpenMM loads modules with kernels:
изображение

@philipturner
Copy link
Contributor

OpenCL is encoding the findInteractionsWithBlocks kernel, issuing an event right after, then immediately requesting everything to finish. You're stalling the command stream just to read one value. With Metal that would invoke a 150+ us penalty.

@ex-rzr
Copy link
Contributor

ex-rzr commented Feb 1, 2023

What do you mean by "encoding"?

@philipturner
Copy link
Contributor

I mean issuing the command, making calls into a GPGPU API that the GPU will then execute. I think my analysis was slightly wrong; the OpenCL CPU-side code encodes the force kernel before waiting. That shouldn't starve the GPU unless the driver refuses to flush cached-up commands, when you ask it to wait on an event. We could try forcing a clFlush command before waiting.

@philipturner
Copy link
Contributor

Perhaps you could move this entire function onto the GPU (it seems parallelizable). Have the GPU write certain buffers, which it reads in another kernel. You have persistent GPU threads so perhaps you don't need advanced indirect dispatch API to specify dispatch params.

template <class Real, class Real4, class Mixed, class Mixed4>
void ComputeContext::reorderAtomsImpl() {
// Find the range of positions and the number of bins along each axis.
vector<Real4> oldPosq(paddedNumAtoms);
vector<Real4> oldPosqCorrection(paddedNumAtoms);
vector<Mixed4> oldVelm(paddedNumAtoms);
getPosq().download(oldPosq);
getVelm().download(oldVelm);
if (getUseMixedPrecision())
getPosqCorrection().download(oldPosqCorrection);
Real minx = oldPosq[0].x, maxx = oldPosq[0].x;
Real miny = oldPosq[0].y, maxy = oldPosq[0].y;
Real minz = oldPosq[0].z, maxz = oldPosq[0].z;
Vec3 periodicBoxX, periodicBoxY, periodicBoxZ;
getPeriodicBoxVectors(periodicBoxX, periodicBoxY, periodicBoxZ);
Vec3 invPeriodicBoxSize(1.0/periodicBoxX[0], 1.0/periodicBoxY[1], 1.0/periodicBoxZ[2]);
if (getNonbondedUtilities().getUsePeriodic()) {
minx = miny = minz = 0.0;
maxx = periodicBoxX[0];
maxy = periodicBoxY[1];
maxz = periodicBoxZ[2];
}
else {
for (int i = 1; i < numAtoms; i++) {
const Real4& pos = oldPosq[i];
minx = min(minx, pos.x);
maxx = max(maxx, pos.x);
miny = min(miny, pos.y);
maxy = max(maxy, pos.y);
minz = min(minz, pos.z);
maxz = max(maxz, pos.z);
}
}
// Loop over each group of identical molecules and reorder them.
vector<int> originalIndex(numAtoms);
vector<Real4> newPosq(paddedNumAtoms, Real4(0,0,0,0));
vector<Real4> newPosqCorrection(paddedNumAtoms, Real4(0,0,0,0));
vector<Mixed4> newVelm(paddedNumAtoms, Mixed4(0,0,0,0));
vector<mm_int4> newCellOffsets(numAtoms);
for (auto& mol : moleculeGroups) {
// Find the center of each molecule.
int numMolecules = mol.offsets.size();
vector<int>& atoms = mol.atoms;
vector<Real4> molPos(numMolecules);
Real invNumAtoms = (Real) (1.0/atoms.size());
for (int i = 0; i < numMolecules; i++) {
molPos[i].x = 0.0f;
molPos[i].y = 0.0f;
molPos[i].z = 0.0f;
for (int j = 0; j < (int)atoms.size(); j++) {
int atom = atoms[j]+mol.offsets[i];
const Real4& pos = oldPosq[atom];
molPos[i].x += pos.x;
molPos[i].y += pos.y;
molPos[i].z += pos.z;
}
molPos[i].x *= invNumAtoms;
molPos[i].y *= invNumAtoms;
molPos[i].z *= invNumAtoms;
if (molPos[i].x != molPos[i].x)
throw OpenMMException("Particle coordinate is NaN. For more information, see https://github.com/openmm/openmm/wiki/Frequently-Asked-Questions#nan");
}
if (getNonbondedUtilities().getUsePeriodic()) {
// Move each molecule position into the same box.
for (int i = 0; i < numMolecules; i++) {
Real4 center = molPos[i];
int zcell = (int) floor(center.z*invPeriodicBoxSize[2]);
center.x -= zcell*periodicBoxZ[0];
center.y -= zcell*periodicBoxZ[1];
center.z -= zcell*periodicBoxZ[2];
int ycell = (int) floor(center.y*invPeriodicBoxSize[1]);
center.x -= ycell*periodicBoxY[0];
center.y -= ycell*periodicBoxY[1];
int xcell = (int) floor(center.x*invPeriodicBoxSize[0]);
center.x -= xcell*periodicBoxX[0];
if (xcell != 0 || ycell != 0 || zcell != 0) {
Real dx = molPos[i].x-center.x;
Real dy = molPos[i].y-center.y;
Real dz = molPos[i].z-center.z;
molPos[i] = center;
for (int j = 0; j < (int) atoms.size(); j++) {
int atom = atoms[j]+mol.offsets[i];
Real4 p = oldPosq[atom];
p.x -= dx;
p.y -= dy;
p.z -= dz;
oldPosq[atom] = p;
posCellOffsets[atom].x -= xcell;
posCellOffsets[atom].y -= ycell;
posCellOffsets[atom].z -= zcell;
}
}
}
}
// Select a bin for each molecule, then sort them by bin.
bool useHilbert = (numMolecules > 5000 || atoms.size() > 8); // For small systems, a simple zigzag curve works better than a Hilbert curve.
Real binWidth;
if (useHilbert)
binWidth = (Real) (max(max(maxx-minx, maxy-miny), maxz-minz)/255.0);
else
binWidth = (Real) (0.2*getNonbondedUtilities().getMaxCutoffDistance());
Real invBinWidth = (Real) (1.0/binWidth);
int xbins = 1 + (int) ((maxx-minx)*invBinWidth);
int ybins = 1 + (int) ((maxy-miny)*invBinWidth);
vector<pair<int, int> > molBins(numMolecules);
bitmask_t coords[3];
for (int i = 0; i < numMolecules; i++) {
int x = (int) ((molPos[i].x-minx)*invBinWidth);
int y = (int) ((molPos[i].y-miny)*invBinWidth);
int z = (int) ((molPos[i].z-minz)*invBinWidth);
int bin;
if (useHilbert) {
coords[0] = x;
coords[1] = y;
coords[2] = z;
bin = (int) hilbert_c2i(3, 8, coords);
}
else {
int yodd = y&1;
int zodd = z&1;
bin = z*xbins*ybins;
bin += (zodd ? ybins-y : y)*xbins;
bin += (yodd ? xbins-x : x);
}
molBins[i] = pair<int, int>(bin, i);
}
sort(molBins.begin(), molBins.end());
// Reorder the atoms.
for (int i = 0; i < numMolecules; i++) {
for (int atom : atoms) {
int oldIndex = mol.offsets[molBins[i].second]+atom;
int newIndex = mol.offsets[i]+atom;
originalIndex[newIndex] = atomIndex[oldIndex];
newPosq[newIndex] = oldPosq[oldIndex];
if (getUseMixedPrecision())
newPosqCorrection[newIndex] = oldPosqCorrection[oldIndex];
newVelm[newIndex] = oldVelm[oldIndex];
newCellOffsets[newIndex] = posCellOffsets[oldIndex];
}
}
}
// Update the arrays.
ContextSelector selector(*this);
for (int i = 0; i < numAtoms; i++) {
atomIndex[i] = originalIndex[i];
posCellOffsets[i] = newCellOffsets[i];
}
getPosq().upload(newPosq);
if (getUseMixedPrecision())
getPosqCorrection().upload(newPosqCorrection);
getVelm().upload(newVelm);
getAtomIndexArray().upload(atomIndex);
for (auto listener : reorderListeners)
listener->execute();
}

This removes the need to break the command stream. If you don't want to find interactions, simply return early inside the appropriate kernel.

@egallicc
Copy link
Contributor

egallicc commented Feb 1, 2023

@egallicc would you mind comparing power consumption to ns/day on HIP like I did, but without erasing downloadCountEvent? Then we can investigate whether HIP reached a genuine 1000 ns/day on RX 6750 XT, by comparing Δns/day to ΔW.

I will try but not before the weekend. Teaching has resumed. :( I wouldn't want to be the bottleneck on this. Would it help if I shared my docker image to build OpenMM with HIP on Linux?

@philipturner
Copy link
Contributor

philipturner commented Feb 1, 2023

I will try but not before the weekend. Teaching has resumed. :( I wouldn't want to be the bottleneck on this. Would it help if I shared my docker image to build OpenMM with HIP on Linux?

I don't have HIP - I have an Apple GPU but I meant "compare changes in the same style I did". The change is using OpenCL vs using HIP. Maybe someone else with AMD would install Linux?

@philipturner
Copy link
Contributor

I found a solution. The following boosted apoa1rf from 115 ns/day to 129 ns/day.

void MetalNonbondedUtilities::computeInteractions(int forceGroups, bool includeForces, bool includeEnergy) {
    if ((forceGroups&groupFlags) == 0)
        return;
    KernelSet& kernels = groupKernels[forceGroups];
    if (kernels.hasForces) {
        // ADD THIS LINE TO EXISTING CODE
        if (useCutoff && numTiles > 0)
            context.getQueue().flush();
        
        cl::Kernel& kernel = (includeForces ? (includeEnergy ? kernels.forceEnergyKernel : kernels.forceKernel) : kernels.energyKernel);
        if (*reinterpret_cast<cl_kernel*>(&kernel) == NULL)
            kernel = createInteractionKernel(kernels.source, parameters, arguments, true, true, forceGroups, includeForces, includeEnergy);
        if (useCutoff)
            setPeriodicBoxArgs(context, kernel, 9);
        context.executeKernel(kernel, numForceThreadBlocks*forceThreadBlockSize, forceThreadBlockSize);
    }
    if (useCutoff && numTiles > 0) {
        // ADD THIS LINE TO EXISTING CODE
        if (kernels.hasForces)
            context.getQueue().flush();
        
        downloadCountEvent.wait();
        updateNeighborListSize();
    }
}

@peastman
Copy link
Member Author

peastman commented Feb 1, 2023

Interesting! I have no idea why that would make a difference. Here's what I see running the PME benchmark on a few different GPUs. On each one I tried four versions: the original code, removing the call to wait(), removing both the download and the wait, and keeping everything but adding the two calls to flush().

RTX 4080: It mostly makes no difference. Almost all versions are a steady 1424 ns/day. The only exception is the version where I removed the download, which was slightly slower but also seemed rather noisy. I suspect those runs were slower for an unrelated reason.

M1 Pro: The original was 130 ns/day. All the others were 147. The slowdown comes from the wait(), but the flush() removes it.

Radeon RX 5700 XT: The original is 320 ns/day. As posted above, skipping the wait speeds it up a little to 340, and skipping the download speeds it up a lot to 406. Adding flush() is almost as fast, 400 ns/day.

It looks like we may have a good optimization here. I just wish I understood why it worked! It feels a little like black magic.

@philipturner
Copy link
Contributor

I totally agree. This counterproductive behavior of all hardware vendors is hurting progress and shows little respect for people's development efforts.

I would say that SYCL is the first universal, coordinated attempt to solve this problem. Khronos finally got it right, unlike with OpenCL. The issue - such a solution requires so much engineering effort, it's still in its infancy. Up until recently only Intel sponsored it, so it got lopped in with oneAPI. Most people think SYCL is just "another CUDA", "another HIP" but that's inaccurate.

@peastman
Copy link
Member Author

peastman commented Feb 6, 2023

Keep in mind that our resources are very limited. As in, I'm the only developer who works full time on OpenMM! I'm also the only developer who has been around for anything close to the full life of the project. It's not just about how to get the fastest performance on a particular GPU right now. It's about how to create a codebase that's easy to maintain and easy to add new features to. It's also about building on technologies that are around for the long term. And it's about how to prioritize effort to best serve our users.

Here's the reality we have to work with: the vast majority of production simulations are run on NVIDIA GPUs. That makes them more important than all other platforms put together. That's not a reality I'm very happy with. I want there to be more competition. I really want AMD to get serious about HPC. But I also can't afford to dedicate too much time to it, and I certainly can't do anything that would add a major ongoing maintenance burden. Writing a new platform is a lot of work, but maintaining it long term is much more work.

I've also been burned by AMD repeatedly. The very first implementation of OpenMM ran on AMD GPUs. It was written in Brook+, which was the language they were promoting for GPGPU at the time. Then they abandoned it and switched to OpenCL, which they declared was the hot new thing they were 100% committed to. And they were... right until they suddenly declared that HIP was the new hot new thing they were 100% committed to. But maybe we should instead be using SYCL, which is the even newer new hot new thing. Through all of this, AMD has never shown any sign of really being committed to HPC, or even of understanding it. Example: their compute profiler doesn't even work on Linux. Example: instead of continuing to invest in OpenCL, a cross platform standard that lots of developers have put a lot of work into supporting, they decide the whole community needs to rewrite their code to support a new proprietary API.

Sorry for complaining. :) It's hard not to be bitter when you've been through too many rounds of this. And AMD is hardly alone in this. It was Apple that originally developed OpenCL. That was back when they were still struggling to compete with Microsoft and were trying to convince developers to use open standards instead of DirectX. Once the iPhone became a dominant platform, they suddenly decided they didn't like open standards anymore and pushed everyone to use their proprietary APIs. Intel also used to be 100% dedicated to OpenCL, until they decided to create oneAPI instead.

The reason NVIDIA has come to dominate the market is that they're the only ones who've been consistent over the long term. CUDA was introduced back in 2007 and they've stuck with it ever since. They also have consistently made good hardware that was well suited to HPC. Unlike, say, the Xeon Phi monstrosity Intel tried to dump on us.

@philipturner
Copy link
Contributor

Maybe we can just consider it hypothetically. I'm not saying we have to implement a backend. It's also a good idea to wait, see if it really sticks. By the time it does, OpenCL might really start showing its wrinkles. The US recently banned exports of A100s and H100s to China, yet crippled their semiconductor production capabilities. Simple reasoning suggests they'll rise back up, with custom Chinese accelerators in ~5-10 years (as @DanielWicz mentioned). Will those fresh hardware support then-ancient standards like OpenGL and OpenCL?

Right now I can maintain the Metal backend, maybe for 5 years, but not for 20. That's the same timeframe where we might see SYCL become established. In any case it's good to prepare for the future, anticipate how that might impact OpenMM.

@peastman
Copy link
Member Author

peastman commented Feb 6, 2023

I'm certainly hoping for things to swing back toward standards again!

@peastman
Copy link
Member Author

peastman commented Feb 6, 2023

Back to the original subject, it looks like the effect of adding the flush() calls is all over the place. Just looking at @ex-rzr's results, each of the three GPUs has a different pattern. On MI210 it consistently makes all benchmarks slower. On MI100 and V620 it makes some benchmarks faster and others slower, but not the same ones. For example, on MI100 it makes the GBSA benchmark faster, but on V620 it makes that benchmark slower.

So for AMD, this probably isn't a useful optimization. If we can figure out why it produces a speedup in some cases and a slowdown in others, perhaps we can find a better approach that consistently makes it faster (or at least not slower).

For Apple I think it could be useful. I believe it always produces a speedup on all computers we've tested? If so, we could perform the flushes on Apple GPUs only.

@egallicc
Copy link
Contributor

egallicc commented Feb 6, 2023

Keep in mind that our resources are very limited.

Is limiting "internal" development to the Common and OpenCL platforms a realistic possibility?

I've also been burned by AMD repeatedly.

Exactly. Hardware vendors made the mess and should, ideally, own the consequences as well. Meaning they should put the resources to support their hardware with their language inventions.

But, to be fair, in this case, AMD cleaned up the mess a bit. The HIP work appears very good--judging only by the performance and ease of installation. The question is how much additional work has cost you to interact with them and how much more work it will take to fully incorporate their implementation into OpenMM.

@philipturner
Copy link
Contributor

Is limiting "internal" development to the Common and OpenCL platforms a realistic possibility?

What if the community converged and made a SYCL backend as a plugin? HIP, Metal, and others would all be able to use the backend.

@DanielWicz
Copy link

DanielWicz commented Feb 7, 2023

There's a table in my computing center (CINES) that summarizes nicely all the frameworks
image

@bdenhollander
Copy link
Contributor

@ex-rzr Thank you for the benchmarks of the three flush version. Would you also be able to run benchmarks with only 1 flush enabled? First try only before forcesKernel (Perm 1) and then only after clEnqueueReadBuffer (Perm 5). The extra pauses introduced by multiple flushes may be cancelling out the gains from a beneficial flush.

@ex-rzr
Copy link
Contributor

ex-rzr commented Feb 8, 2023

MI100

8.0.0

Test              Precision   Constraints   H mass (amu)   dt (fs)   Ensemble   Platform   ns/day
gbsa              single      HBonds        1.5            4         NVT        OpenCL     750.309
rf                single      HBonds        1.5            4         NVT        OpenCL     520.171
pme               single      HBonds        1.5            4         NVT        OpenCL     299.185
apoa1rf           single      HBonds        1.5            4         NVT        OpenCL     167.932
apoa1pme          single      HBonds        1.5            4         NVT        OpenCL     111.471
apoa1ljpme        single      HBonds        1.5            4         NVT        OpenCL     92.7899
amoebagk          single      None          1              2         NVT        OpenCL     2.02475
amoebapme         single      None          1              2         NVT        OpenCL     9.03818
amber20-dhfr      single      HBonds        1.5            4         NVT        OpenCL     339.465
amber20-cellulose single      HBonds        1.5            4         NVT        OpenCL     25.1879
amber20-stmv      single      HBonds        1.5            4         NVT        OpenCL     8.13449

before forcesKernel (Perm 1)

Test              Precision   Constraints   H mass (amu)   dt (fs)   Ensemble   Platform   ns/day
gbsa              single      HBonds        1.5            4         NVT        OpenCL     770.383
rf                single      HBonds        1.5            4         NVT        OpenCL     533.668
pme               single      HBonds        1.5            4         NVT        OpenCL     306.073
apoa1rf           single      HBonds        1.5            4         NVT        OpenCL     170.581
apoa1pme          single      HBonds        1.5            4         NVT        OpenCL     111.059
apoa1ljpme        single      HBonds        1.5            4         NVT        OpenCL     91.6098
amoebagk          single      None          1              2         NVT        OpenCL     2.02818
amoebapme         single      None          1              2         NVT        OpenCL     9.04325
amber20-dhfr      single      HBonds        1.5            4         NVT        OpenCL     342.845
amber20-cellulose single      HBonds        1.5            4         NVT        OpenCL     28.4718
amber20-stmv      single      HBonds        1.5            4         NVT        OpenCL     8.11413

after clEnqueueReadBuffer (Perm 5)

Test              Precision   Constraints   H mass (amu)   dt (fs)   Ensemble   Platform   ns/day
gbsa              single      HBonds        1.5            4         NVT        OpenCL     773.396
rf                single      HBonds        1.5            4         NVT        OpenCL     541.363
pme               single      HBonds        1.5            4         NVT        OpenCL     303.659
apoa1rf           single      HBonds        1.5            4         NVT        OpenCL     171.381
apoa1pme          single      HBonds        1.5            4         NVT        OpenCL     113.235
apoa1ljpme        single      HBonds        1.5            4         NVT        OpenCL     93.8418
amoebagk          single      None          1              2         NVT        OpenCL     2.02443
amoebapme         single      None          1              2         NVT        OpenCL     9.01838
amber20-dhfr      single      HBonds        1.5            4         NVT        OpenCL     348.567
amber20-cellulose single      HBonds        1.5            4         NVT        OpenCL     25.1565
amber20-stmv      single      HBonds        1.5            4         NVT        OpenCL     8.12385

MI210

8.0.0

Test              Precision   Constraints   H mass (amu)   dt (fs)   Ensemble   Platform   ns/day
gbsa              single      HBonds        1.5            4         NVT        OpenCL     801.239
rf                single      HBonds        1.5            4         NVT        OpenCL     556.119
pme               single      HBonds        1.5            4         NVT        OpenCL     330.539
apoa1rf           single      HBonds        1.5            4         NVT        OpenCL     185.013
apoa1pme          single      HBonds        1.5            4         NVT        OpenCL     122.989
apoa1ljpme        single      HBonds        1.5            4         NVT        OpenCL     97.3263
amoebagk          single      None          1              2         NVT        OpenCL     2.3329
amoebapme         single      None          1              2         NVT        OpenCL     9.84983
amber20-dhfr      single      HBonds        1.5            4         NVT        OpenCL     363.889
amber20-cellulose single      HBonds        1.5            4         NVT        OpenCL     25.9868
amber20-stmv      single      HBonds        1.5            4         NVT        OpenCL     7.9088

before forcesKernel (Perm 1)

Test              Precision   Constraints   H mass (amu)   dt (fs)   Ensemble   Platform   ns/day
gbsa              single      HBonds        1.5            4         NVT        OpenCL     788.712
rf                single      HBonds        1.5            4         NVT        OpenCL     556.46
pme               single      HBonds        1.5            4         NVT        OpenCL     323.952
apoa1rf           single      HBonds        1.5            4         NVT        OpenCL     183.917
apoa1pme          single      HBonds        1.5            4         NVT        OpenCL     121.757
apoa1ljpme        single      HBonds        1.5            4         NVT        OpenCL     97.4903
amoebagk          single      None          1              2         NVT        OpenCL     2.33588
amoebapme         single      None          1              2         NVT        OpenCL     9.87685
amber20-dhfr      single      HBonds        1.5            4         NVT        OpenCL     358.072
amber20-cellulose single      HBonds        1.5            4         NVT        OpenCL     26.1034
amber20-stmv      single      HBonds        1.5            4         NVT        OpenCL     7.90336

after clEnqueueReadBuffer (Perm 5)

Test              Precision   Constraints   H mass (amu)   dt (fs)   Ensemble   Platform   ns/day
gbsa              single      HBonds        1.5            4         NVT        OpenCL     802.347
rf                single      HBonds        1.5            4         NVT        OpenCL     561.416
pme               single      HBonds        1.5            4         NVT        OpenCL     324.969
apoa1rf           single      HBonds        1.5            4         NVT        OpenCL     185.25
apoa1pme          single      HBonds        1.5            4         NVT        OpenCL     124.16
apoa1ljpme        single      HBonds        1.5            4         NVT        OpenCL     97.9939
amoebagk          single      None          1              2         NVT        OpenCL     2.33307
amoebapme         single      None          1              2         NVT        OpenCL     9.82599
amber20-dhfr      single      HBonds        1.5            4         NVT        OpenCL     362.277
amber20-cellulose single      HBonds        1.5            4         NVT        OpenCL     26.1178
amber20-stmv      single      HBonds        1.5            4         NVT        OpenCL     7.9478

V620

8.0.0

Test              Precision   Constraints   H mass (amu)   dt (fs)   Ensemble   Platform   ns/day
gbsa              single      HBonds        1.5            4         NVT        OpenCL     885.712
rf                single      HBonds        1.5            4         NVT        OpenCL     778.101
pme               single      HBonds        1.5            4         NVT        OpenCL     326.576
apoa1rf           single      HBonds        1.5            4         NVT        OpenCL     303.421
apoa1pme          single      HBonds        1.5            4         NVT        OpenCL     155.245
apoa1ljpme        single      HBonds        1.5            4         NVT        OpenCL     110.594
amoebagk          single      None          1              2         NVT        OpenCL     2.08787
amoebapme         single      None          1              2         NVT        OpenCL     10.5296
amber20-dhfr      single      HBonds        1.5            4         NVT        OpenCL     356.601
amber20-cellulose single      HBonds        1.5            4         NVT        OpenCL     34.0437
amber20-stmv      single      HBonds        1.5            4         NVT        OpenCL     9.74731

before forcesKernel (Perm 1)

Test              Precision   Constraints   H mass (amu)   dt (fs)   Ensemble   Platform   ns/day
gbsa              single      HBonds        1.5            4         NVT        OpenCL     850.839
rf                single      HBonds        1.5            4         NVT        OpenCL     745.627
pme               single      HBonds        1.5            4         NVT        OpenCL     364.235
apoa1rf           single      HBonds        1.5            4         NVT        OpenCL     318.617
apoa1pme          single      HBonds        1.5            4         NVT        OpenCL     154.077
apoa1ljpme        single      HBonds        1.5            4         NVT        OpenCL     109.724
amoebagk          single      None          1              2         NVT        OpenCL     2.09071
amoebapme         single      None          1              2         NVT        OpenCL     10.5216
amber20-dhfr      single      HBonds        1.5            4         NVT        OpenCL     379.88
amber20-cellulose single      HBonds        1.5            4         NVT        OpenCL     38.3378
amber20-stmv      single      HBonds        1.5            4         NVT        OpenCL     9.71824

after clEnqueueReadBuffer (Perm 5)

Test              Precision   Constraints   H mass (amu)   dt (fs)   Ensemble   Platform   ns/day
gbsa              single      HBonds        1.5            4         NVT        OpenCL     872.109
rf                single      HBonds        1.5            4         NVT        OpenCL     792.096
pme               single      HBonds        1.5            4         NVT        OpenCL     334.976
apoa1rf           single      HBonds        1.5            4         NVT        OpenCL     307.479
apoa1pme          single      HBonds        1.5            4         NVT        OpenCL     160.66
apoa1ljpme        single      HBonds        1.5            4         NVT        OpenCL     114.151
amoebagk          single      None          1              2         NVT        OpenCL     2.08753
amoebapme         single      None          1              2         NVT        OpenCL     10.674
amber20-dhfr      single      HBonds        1.5            4         NVT        OpenCL     361.81
amber20-cellulose single      HBonds        1.5            4         NVT        OpenCL     34.3507
amber20-stmv      single      HBonds        1.5            4         NVT        OpenCL     9.74555

@philipturner
Copy link
Contributor

MI100 Original Perm 1 Perm 2 Δ Perm 1 Δ Perm 5
gbsa 750.3 770.4 773.4 2.68% 3.08%
rf 520.2 533.7 541.4 2.60% 4.08%
pme 299.2 306.1 303.7 2.31% 1.50%
apoa1rf 167.9 170.6 171.4 1.61% 2.08%
apoa1pme 111.5 111.1 113.2 -0.36% 1.52%
apoa1ljpme 92.8 91.6 92.8 -1.29% 0.00%
amoebagk 2.025 2.028 2.024 0.15% -0.05%
amoebapme 9.038 9.043 9.018 0.06% -0.22%
amber20-dhfr 339.5 342.8 348.6 0.97% 2.68%
amber20-cellulose 25.19 28.47 25.16 13.02% -0.12%
amber20-stmv 8.134 8.114 8.124 -0.25% -0.12%
MI210 Original Perm 1 Perm 2 Δ Perm 1 Δ Perm 5
gbsa 801.2 788.8 802.3 -1.55% 0.14%
rf 556.1 556.5 561.4 0.07% 0.95%
pme 330.5 324.0 325.0 -1.97% -1.66%
apoa1rf 185.0 183.9 185.3 -0.59% 0.16%
apoa1pme 123.0 121.8 124.2 -0.98% 0.98%
apoa1ljpme 97.3 97.49 97.99 0.20% 0.71%
amoebagk 2.333 2.336 2.333 0.13% 0.00%
amoebapme 9.850 9.877 9.826 0.27% -0.24%
amber20-dhfr 363.9 358.1 362.3 -1.59% -0.44%
amber20-cellulose 25.99 26.10 26.12 0.42% 0.50%
amber20-stmv 7.909 7.903 7.948 -0.08% 0.49%
V620 Original Perm 1 Perm 2 Δ Perm 1 Δ Perm 5
gbsa 885.7 850.8 872.1 -3.94% -1.54%
rf 778.1 745.6 792.1 -4.18% 1.80%
pme 326.6 364.2 335.0 11.51% 2.57%
apoa1rf 303.4 318.6 307.5 5.01% 1.35%
apoa1pme 155.2 154.1 160.7 -0.71% 3.54%
apoa1ljpme 110.6 109.7 114.2 -0.81% 3.25%
amoebagk 2.088 2.091 2.088 0.14% 0.00%
amoebapme 10.53 10.52 10.67 -0.09% 1.33%
amber20-dhfr 356.6 379.9 361.8 6.53% 1.46%
amber20-cellulose 34.04 38.34 34.35 12.63% 0.91%
amber20-stmv 9.747 9.718 9.746 -0.30% -0.01%

Perhaps try the optimization here?

@peastman
Copy link
Member Author

peastman commented Feb 8, 2023

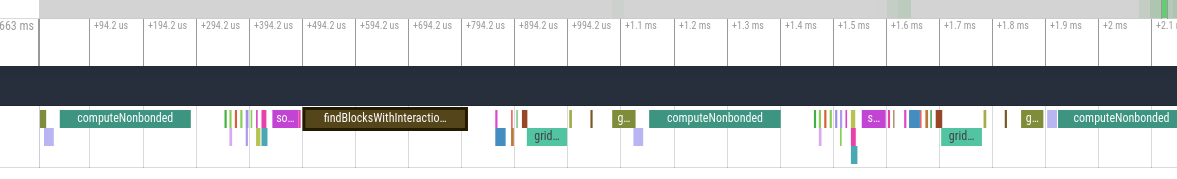
I used the changes in #3954 to profile on AMD. Here's a timeline for PME with the original code.

image

There are gaps of 50-60 us after computeNonbonded and findBlocksWithInteractions. The timeline makes it look like there are also gaps after finishSpreadCharge and reciprocalConvolution, but there aren't really. Those are the FFTs. It only captures kernels launched through OpenCLContext, so it doesn't show the ones launched by VkFFT.

Here's what it looks like with a flush() immediately before launching computeNonbonded.

image

There's no longer a significant gap after computeNonbonded, but instead we have a gap of a similar size immediately before it. So why is it faster? According to the profile, it isn't. It shows the time per step as basically unchanged at 1.1 ms. Which suggests that profiling is distorting the results and changing the thing I'm trying to measure. :(

Here's the timeline for apoa1pme (original code).

image

The same gaps are there as before. The one after findBlocksWithInteractions is about the same size as before, which makes it less significant in relation to the length of the kernels. The one after computeNonbonded has grown roughly in proportion to how long the kernel execution has grown, so it's still a similar fraction of the time.

And here it is with flush().

image

No significant change to much of anything.

@bdenhollander
Copy link
Contributor

@peastman This is really cool what you've put together!

You may get a better idea of what's going on if you increase the precision of start time to string conversion to 8 digits.

6 digits says these started simultaneously:

{ "pid":1, "tid":1, "ts":9.56276e+06, "dur":0.28, "ph":"X", "name":"applyShakeToVelocities" },
{ "pid":1, "tid":1, "ts":9.56276e+06, "dur":0.28, "ph":"X", "name":"calcCenterOfMassMomentum" },
{ "pid":1, "tid":1, "ts":9.56276e+06, "dur":11.04, "ph":"X", "name":"removeCenterOfMassMomentum" },

8 digits shows 2-3 us apart:

{ "pid":1, "tid":1, "ts":11581297, "dur":0.28, "ph":"X", "name":"applyShakeToVelocities" },
{ "pid":1, "tid":1, "ts":11581300, "dur":0.28, "ph":"X", "name":"calcCenterOfMassMomentum" },
{ "pid":1, "tid":1, "ts":11581302, "dur":18.52, "ph":"X", "name":"removeCenterOfMassMomentum" },

@philipturner
Copy link
Contributor

Which suggests that profiling is distorting the results and changing the thing I'm trying to measure.

With CL_QUEUE_ENABLE_PROFILING, the queue flushes after every single OpenCL API call. You would never be able to measure the affect of flush() that way.

@peastman
Copy link
Member Author

peastman commented Feb 9, 2023

With CL_QUEUE_ENABLE_PROFILING, the queue flushes after every single OpenCL API call.

Where did you find that?

@philipturner
Copy link
Contributor

Where did you find that?

I mentioned it a while ago on the "future of osx GPU support" thread. That why initially, when I didn't know how the Mac OpenCL driver worked, I was worried. My hypothesis, it flushed after every command, causing severe CPU-side overhead. Switching to Metal would make the overhead preventable. Recently, you were there when I learned the Mac OpenCL driver does not do that. The driver does not flush after every command.

That is, unless you enable profiling. The only way that's accomplishable, submit each command in its own command buffer. Time the beginning and end of the command buffer. Creating a new command buffer is by definition flushing the queue. This limitation is universal to GPU vendors, including AMD. this hyperlink -> Cmd + F + "Enabling profiling"

@peastman
Copy link
Member Author

peastman commented Feb 9, 2023

That hypothesis were true, then adding the extra flush() call would have no effect when profiling is enabled. In fact, it still produces a speedup. It's only when we create the extra events and wait on them that the benefit goes away.

You're making assumptions about how the GPU works: that profiling is implemented entirely on the host side. In fact, many GPUs have hardware support for profiling and can automatically collect lots of metrics. For those GPUs, the profiling API is just a way of querying the data collected by the GPU. It need not have any impact on how the host dispatches work to it.

bdenhollander added a commit to bdenhollander/openmm that referenced this issue Feb 20, 2023
- Implements perm 5 from openmm#3937 (comment)

Co-Authored-By: Philip Turner <philipturner.AR@gmail.com>
@bdenhollander
Copy link
Contributor

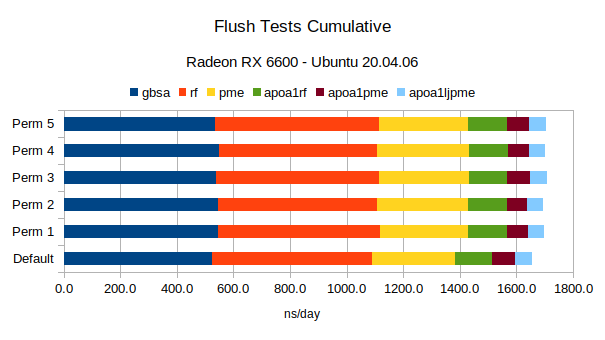
Linux flush tests results on RX 6600. Perm 3 and 5 provide the most consistent outcomes.
Windows results favouring Perm 5 and 1 are here.

ns/day gbsa rf pme apoa1rf apoa1pme apoa1ljpme
Default 525.6 563.7 292.9 132.9 79.3 60.7
Perm 1 547.5 569.2 310.8 138.1 74.8 56.8
Perm 2 544.3 562.5 321.8 137.6 72.9 56.6
Perm 3 538.4 576.9 315.9 137.0 78.4 60.8
Perm 4 548.1 561.1 322.0 139.9 72.8 57.1
Perm 5 536.3 577.8 315.1 136.9 78.2 60.7

image

gbsa rf pme apoa1rf apoa1pme apoa1ljpme
Perm 1 4.15% 0.97% 6.08% 3.91% -5.67% -6.38%
Perm 2 3.55% -0.21% 9.86% 3.50% -8.05% -6.73%
Perm 3 2.42% 2.34% 7.85% 3.04% -1.14% 0.29%
Perm 4 4.27% -0.45% 9.90% 5.24% -8.23% -5.81%
Perm 5 2.04% 2.51% 7.57% 2.99% -1.38% 0.04%

image

peastman pushed a commit that referenced this issue Oct 24, 2023
* Enable flush on Windows

- Implements perm 5 from #3937 (comment)

Co-Authored-By: Philip Turner <philipturner.AR@gmail.com>

* Add brackets for clarification

Co-authored-by: Philip Turner <philipturner.AR@gmail.com>

* Make this optimization only apply to AMD GPUs

* Switch to perm 1

- Flush before call to computeNonbonded since it works well on Windows and Linux

* Update OpenCLNonbondedUtilities.cpp

* Perm 4 is now significantly faster on Windows

* Use isAMD

* Fix indentation

* Fix missed variable

* Remove Mac check

* Remove isAMD out of Mac code

* Consistent (lack of) brackets style

---------

Co-authored-by: Philip Turner <philipturner.AR@gmail.com>
@bdenhollander
Copy link
Contributor

We've made some substantial gains in OpenCL performance on AMD over the past 10 months! Thank you @philipturner for bringing great ideas and @peastman for your assistance implementing them.

Test OpenMM 8.0
ns/day
OpenMM 8.1
ns/day
Change
gbsa 466.871 660.375 41.4%
rf 471.553 584.512 24.0%
pme 311.9 440.685 41.3%
apoa1rf 147.405 164.656 11.7%
apoa1pme 89.5964 109.023 21.7%
apoa1ljpme 68.706 82.2956 19.8%
amoebagk 1.08652 1.08781 0.1%
amoebapme 0.952845 1.10331 15.8%
amber20-dhfr 327.126 478.553 46.3%
amber20-cellulose 17.9677 25.0283 39.3%
amber20-stmv 4.29275 7.27965 69.6%

8 0 vs 8 1

@peastman
Copy link
Member Author

peastman commented Nov 3, 2023

That's excellent! Thanks for pushing on this. It's good to see we've made real progress.

@philipturner
Copy link
Contributor

This is also great because I have an AMD 7900 XTX, just waiting until I need to run a larger simulation before I get the Linux box wired up.

Sign up for free to join this conversation on GitHub. Already have an account? Sign in to comment
Projects
None yet
Development

No branches or pull requests

6 participants