I will be doing a network app of the month series of blog posts. For some it will be someone else's cool project I see on Github and Docker Hub Registry, other times like this one I will stitch together an app to share. In this example we will use Docker Machine, Docker Compose and Docker Engine to bring up bandwidth measurements of both inside your data center and to the Internet.
What I like about this example networking use case is folks can start thinking about immutable infrastructures. In this example we will spin up a poller and agents to be polled. After each polling round, the poller and agent containers are deleted. As the next polling cycle comes along we simply start new containers. So the beauty is I no longer have to worry about the state of the long running service.
The longer an application runs the greater the odds of its state getting screwed up and eventually fail. Now when I write the code to interact with distributed systems, the odds are much better that I will avoid any issues with the process doing its event since I only have to worry about it running for the amount of time to process the workload rather then running without issue indefinitely/infinitely. There is a reason Google can boast about going through 2billion containers a week, when you treat build a throw away infra it is inherent to the philosophy to recreate the environment to the exact pristine state you desire for each new workload. Its getting a new car every time you drive to the store.
-
Network Engineers having easy access to compute cycles without having to concern themselves with any care and feeding of the underlying OS (patch management, licensing etc).
-
Have compute in diverse geographical locations. This allows for a diverse view of bandwidth and to better triangulate potential bottlenecks.
-
Historical records of network data. Many of the traditional problems with networking and uptime can be significantly reduced with post-mortem reviews with relevant data to determine root causes of events.
-
The data generated when truly collecting the amount of data necessary to provide next to perfect uptime can be enormous and will compare will likely be on par with your organizations digital information classified as big data . Rather then using traditional RDBMS approaches, using Time Series Databases (TSDB) that are designed to ingest large amounts of timestamped metrics.
-
If you haven't used Docker before check out the docs and this cool tutorial.
For my fellow hack first read later peoples here is the quick up and running instructions. To setup your environment take a look at the Docker Docs and check out some install scripts here. I haven't tested the bash wrapper on anything other then a Mac as I ran out of weekend. This is kinda cool becuase you only need an open port on the target container that is listening for inbound connections to measure both directions (bi-directional). The client -> server channel is reused for the reverse measurement client <- server. So for example, your poller can be sitting behind a NAT translation or a firewall with no ingress rules allowed to the host and still measure both up and downstream bandwidth.
There is also a version using InfluxDB 0.9.1+ and Grafana v2.2+ at nerdalert/ts-net. The pros are the Influx Time Series DB mechanics are really good, there are less moving parts and the Grafana is migrated to v2.0+ where it was rewritten in Go. The cons are InfluxDB APIs drastically changed with 0.9 and so did the Grafana integration.
- QuickStart Demo
git clone https://github.com/nerdalert/cloud-bandwidth.git
cd cloud-bandwidth/
docker-compose -f run_demo.yml up
Then point a browser to http://<DOCKER_IP>:8000
To stop and remove the demo containers running with compose simply run the following in the same directory as the .yml file:
docker-compose -f run_demo.yml kill
docker-compose -f run_demo.yml rm -f
- Quick start real bandwidth
git clone https://github.com/nerdalert/cloud-bandwidth.git
docker-compose up
In a new terminal, your docker machine should have at least a virtualbox machine defined
Note: The machine (VM) naming needs to match the pattern of driver-foo. 'driver' being one of the dozen or so docker machine drivers and foo being whatever you want to end it with. Both of those with a - delimiting them. For example, vmwarefusion-machine,
Here are the driver names as defined by docker machine:
- amazonec2
- azure
- digitalocean
- openstack
- rackspace
- softlayer
- virtualbox
- vmwarefusion
- vmwarevcloudair
- vmwarevsphere
You can test both source and destination polling for testing on the same machine. Here we will use the virtualbox driver as an example:
If an instance is not already running, start one with a docker-machine create:
docker-machine create \
    --driver virtualbox \
    virtualbox-machine
 docker-machine ls
NAME                   ACTIVE   DRIVER         STATE     URL                         SWARM
virtualbox-machine     *        virtualbox     Running   tcp://192.168.99.101:2376
Then run the bash wrapper with:
cd cloud-bandwidth
chmod +x ./run.sh
./run.sh  -s 45 -p virtualbox-machine -t virtualbox-machine
A simple way to get the external address is:
docker-machine ip vmwarefusion-machine
172.16.166.157
Then point a browser to http://<DOCKER_IP>:8000
If you dont see data in the browser but instead see datapoints outside time range then change your time to the past 12 hours and you should see the data. Javascript is notoriously finicky with timezones. You can explicitly set one or use UTC. I have run into this a couple of times with grafana but havent figured out the pattern yet so will patch the config when I do.
Look in the config.js file where I added some comments on hardcoding a timezone. The default.json in the docker-compose is set to "timezone": "browser" but you can set a timezone explicitly in config.js like so for NY EST timezoneOffset: "-0500",
If you are running the poller (source of attempts) on a docker host running docker natively and not in a VM then pass the machine type as native to the run.sh wrapper like so:
./run.sh -s 30 -p native -t digitalocean-machine
That will run the poller on the localhost docker instance.
git clone https://github.com/nerdalert/cloud-bandwidth.git
cd cloud-bandwidth
docker-machine create --driver virtualbox virtualbox-machine
eval "$(docker-machine env virtualbox-machine)"

docker-machine ls
# NAME                   ACTIVE   DRIVER         STATE     URL                         SWARM
# virtualbox-machine     *        virtualbox     Running   tcp://192.168.99.101:2376
Pass -f and the demo yml file to docker-compose which tells it to use run_demo.yml configurations rather then the default docker-compose.yml that is in the same directory. Again, the -f run_demo.yml is only for running the demo. Later when running with real data you simply use the defaults with docker-compose up
docker-compose -f run_demo.yml up
You will see something like:
carbon_1        | 30/05/2015 10:47:18 :: [listener] MetricLineReceiver connection with 172.17.0.96:54617 established
carbon_1        | 30/05/2015 10:47:18 :: [listener] MetricLineReceiver connection with 172.17.0.96:54617 closed cleanly
That means mock values are being written to to whisper via carbon collector and graphed by Grafana. That is a piece that can be consolidated into Influxdb and Grafana to reduce moving parts, though compose does make it much easier.
When stopping and starting the docker-compose stack I recommend doing the following to
Now point your browser to the grafana UI and see the data being graphed. Get the ip address with:
docker-machine ip virtualbox-machine
# 192.168.99.101

# or docker-machine ls and see the API ip:port '192.168.99.101:2376'

docker-machine ls
# NAME                   ACTIVE   DRIVER         STATE     URL                         SWARM
# virtualbox-machine     *        virtualbox     Running   tcp://192.168.99.101:2376
The docker-compose and dockerfile instruct grafana to use port 8000 8000
http://<MACHINE_IP>:8000
You will begin to see the following be generated:
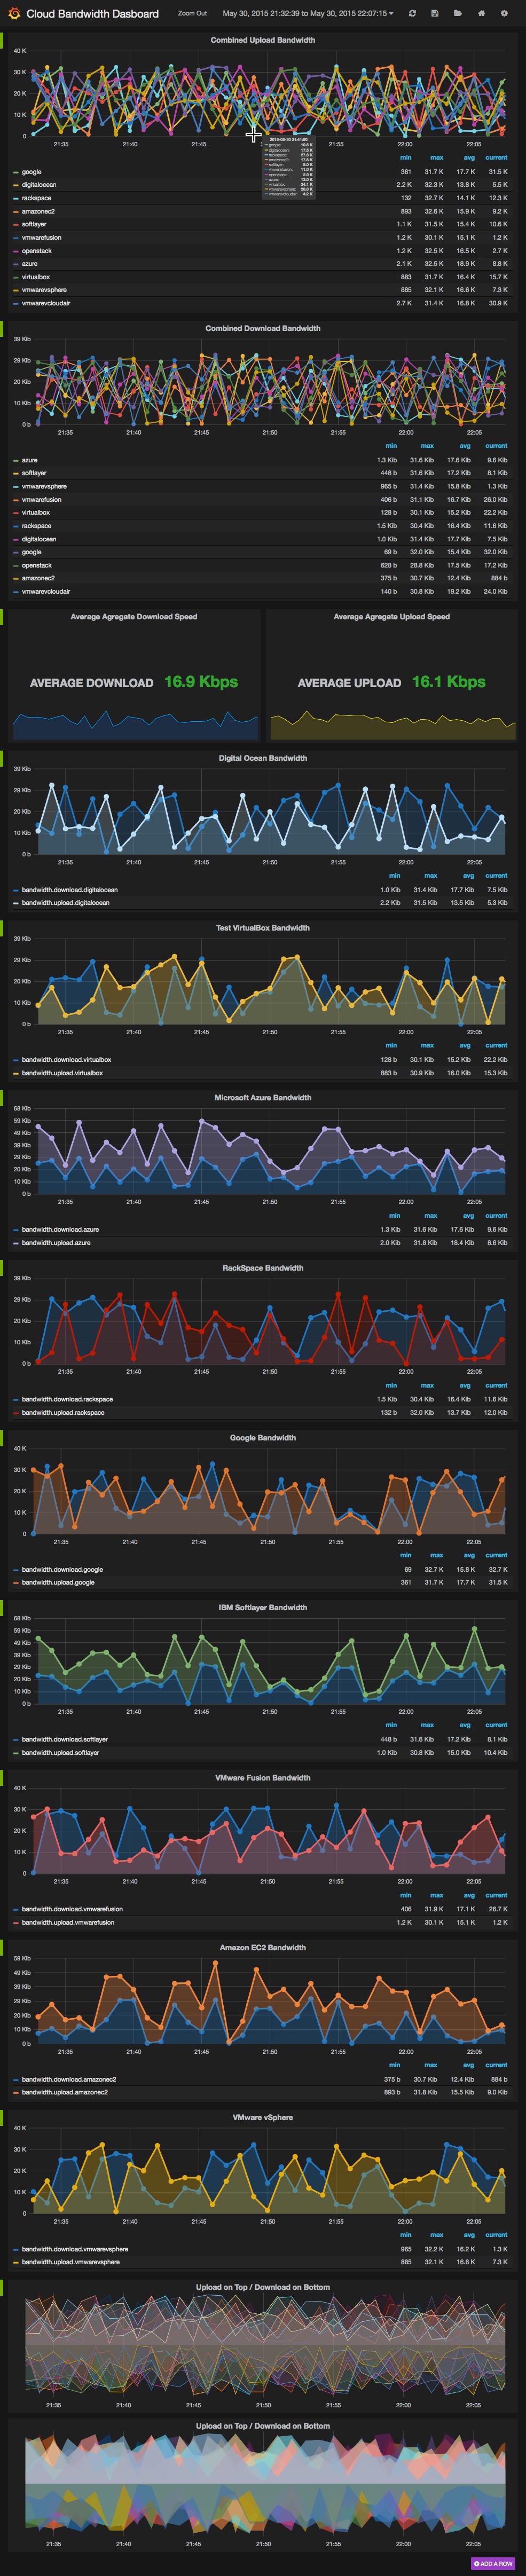
To reiterate these are mock values being written to the TSDB using docker-compose -f run_demo.yml up.
Once done with the demo stop and recreate the containers using the default yml file.
docker-compose -f run_demo.yml kill
docker-compose -f run_demo.yml rm -f
The pre-requisite is to have the docker-machines up and running that you plan on running measurements against. Here is an example of a docker-machine setup. Note: tokens/credentials for each host are stored in ~/.docker/machines
Here is an example of a populated docker-machine ps (all done with trial accounts btw, kudos to the evagilist at those CSPs).
docker-machine ls
NAME                   ACTIVE   DRIVER         STATE     URL                         SWARM
aws-machine                     amazonec2      Running   tcp://54.85.219.54:2376
digitalocean-machine            digitalocean   Stopped   tcp://45.55.146.243:2376
google-machine                  google         Running   tcp://146.148.61.62:2376
virtualbox-machine     *        virtualbox     Running   tcp://192.168.99.101:2376

ls ~/.docker/machine/machines/
virtualbox-machine/   google-machine/       digitalocean-machine/ aws-machine/
Start the non-demo compose build with the following:
docker-compose up
Make sure the TSDB stack is up and running with docker ps or checking connectivity to the TCP ports for tshooting.
To run in the background as a daemon process pass the -d parameter:
There are two required parameters and one optional:
- The
-ttarget machine(s) you are running as iperf agent. - The
-pthe poller that will connect to the iperf agent. - The
-sinterval in seconds between polling intervals. The default is 300 seconds which means the poller will run a measurement every 5 minutes againts the target listeners.
usage: ./run.sh [-s (interval seconds)] [-p (machine that poller runs on)] [-t (list of target servers)]
Make sure the docker-compose stack is still up and running.
First run against the local virtual-box machine as both the client and server to make sure everything works. The iperf image will be downloaded the first time you run listeners on a new VM/Machine.
Note: The polling interval is set pretty low at 60 seconds here for testing purposes. 180-600 seconds (3-10 minutes) seems like reasonable polling boundaries for production.
chmod +x ./run.sh
./run.sh  -s 60 -p virtualbox-machine -t virtualbox-machine
Or another example using VMWare Fusion:
./run.sh -s 30 -p vmwarefusion-machine -t vmwarefusion-machine
Next test using a different driver. In this case I am using the digitalocean driver. I really like the Digital Ocean driver for testing for 2 reason.
- It only requires the token from Digital Ocean to start. While there are lots of parameter you can set, there are very common sense defaults.
- It is also dead simple to setup. They have a free trial and their containers are really cheap.
Rackspace is another really simple one to setup, no mandatory firewall permits etc. AWS and GCE both will block incoming port 5201 connection attempts unless you open it with a rule.
See the more detailed doc in the project for more on creating machines.
Test the port before you start run.sh by telnetting to port 5201 and testing. Since we are running iperf3 using TCP for transport you will get a socket:
docker-machine ip <machine name>
telnet  <IP_address> 5201
telnet $(docker-machine ip digitalocean-machine) 5201
Now add a cloud provider, in this case I am using digital ocean. Make sure docker-machine sees all of the machines you are going to use in a healthy running status:
docker-machine ls
NAME                   ACTIVE   DRIVER         STATE     URL                         SWARM
digitalocean-machine            digitalocean   Running   tcp://45.55.146.243:2376
virtualbox-machine     *        virtualbox     Running   tcp://192.168.99.101:2376
google-machine                  google         Running
Then simply list the new machine(s) after virtualbox-machine with a space betewen them.
./run.sh -s 180 -p virtualbox-machine -t digitalocean-machine virtualbox-machine google-machine
Thats it! Patch, Fork, do whatever you want with it. Thanks to all the various open source projects used for this. Building a throw away infrastrucure is incredibly fun. Special thanks to ESnet for re-rolling iperf into iperf3. It is really nice how the initialized channel from client -> server is reused for the reverse. It gives you bi-directional measurements without having to expose (or NAT) both endpoints, just the channel intiator. And Grafana, well its just awesome. That should be a networkers best friend for pumping data into for data vis.
If you want to modify the bandwidth poller, you can build it locally and it will cache it in your images with the following:
cd bandwidth-poller
docker build -t networkstatic/bandwidth-poller .
If you modify scripts or default.json for example which is the default Grafana dashboard, you need to re-build the container and expire the cache with the old configuration. The simplest way to make sure you remove everything is to delete the image:
docker-compose rm -v
docker rmi cloudbandwidth_graphite
docker-compose build
docker-compose up
Or you can rebuild with --no-cache
docker-compose build --no-cache
To be even more efficient, Docker Compose lets you build individual services as defined in the compose service name.
docker-compose build --no-cache graphite
Here is an image of why I love docker machine. In the context of this App, the poller resides on the host running docker-machine and the bandwidth agent runs on the endpoints:

I noticed AWS and GCE didnt expose port 5201 by default. I havent check whats up there yet. Digital Ocean is very easy to start with. There are also some miscelaneous scripts in, you guessed it, the scripts directory.
docker-machine create \
    --driver vmwarefusion \
    vmwarefusion-machine

docker-machine create \
    --driver virtualbox \
    virtualbox-machine

docker-machine create \
    --driver rackspace \
    --rackspace-username ${RACKSPACE_USERNAME} \
    --rackspace-api-key ${RACKSPACE_KEY} \
    --rackspace-region IAD \
    --rackspace-flavor-id 2 \
    rackspace-machine

docker-machine create -d azure \
    --azure-subscription-id ${AZURE_SUB_ID} \
    --azure-subscription-cert=${AZURE_CERT} \
    azure-machine

docker-machine create \
     --driver digitalocean \
     --digitalocean-access-token ${DIGITAL_OCEAN_TOKEN} \
     digitalocean-machine

docker-machine create \
    --driver google \
    --google-project ${GOOGLE_PROJECT} \
    --google-zone ${GOOGLE_ZONE} \
    google-machine

docker-machine create -d azure \
    --azure-subscription-id ${AZURE_SUB_ID} \
    --azure-subscription-cert=${AZURE_CERT} \
    azure-machine
Here is another little magical pony tidbit, you can use docker-machine ssh <MACHINE_NAME> to open an ssh shell to the underlying machine/VM.
docker-machine ssh vmwarefusion-machine
                        ##         .
                  ## ## ##        ==
               ## ## ## ## ##    ===
           /"""""""""""""""""\___/ ===
      ~~~ {~~ ~~~~ ~~~ ~~~~ ~~~ ~ /  ===- ~~~
           \______ o           __/
             \    \         __/
              \____\_______/
 _                 _   ____     _            _
| |__   ___   ___ | |_|___ \ __| | ___   ___| | _____ _ __
| '_ \ / _ \ / _ \| __| __) / _` |/ _ \ / __| |/ / _ \ '__|
| |_) | (_) | (_) | |_ / __/ (_| | (_) | (__|   <  __/ |
|_.__/ \___/ \___/ \__|_____\__,_|\___/ \___|_|\_\___|_|

  WARNING: this is a test.docker.com build, not a release.

Boot2Docker version 1.7.0-rc1, build master : c347ab0 - Thu May 28 05:31:26 UTC 2015
Docker version 1.7.0-rc1, build 395cced
AWS
$ docker-machine ssh aws-machine
Welcome to Ubuntu 14.04.2 LTS (GNU/Linux 3.13.0-49-generic x86_64)
DigitalOcean
$ docker-machine ssh digitalocean-machine
Welcome to Ubuntu 14.04.1 LTS (GNU/Linux 3.13.0-43-generic x86_64)

 * Documentation:  https://help.ubuntu.com/

  System information as of Fri Jun  5 04:41:23 EDT 2015

  System load: 0.0                Memory usage: 9%   Processes:       51
  Usage of /:  16.8% of 19.56GB   Swap usage:   0%   Users logged in: 0

$ root@digitalocean-machine:~# cat /etc/default/docker

DOCKER_OPTS='
-H tcp://0.0.0.0:2376
-H unix:///var/run/docker.sock
--storage-driver aufs
--tlsverify
--tlscacert /etc/docker/ca.pem
--tlscert /etc/docker/server.pem
--tlskey /etc/docker/server-key.pem
--label provider=digitalocean