[XLA:CPU] Improve Trace emitter #10164
Conversation
|
LGTM but interested in @penpornk 's review. Thanks for the PR!! |
|
Hi @penpornk , can you review this PR? Thanks. |
xla/service/cpu/ir_emitter.cc
Outdated
| // For custom call, passing custom call target is more informative | ||
| hlo_name_str = hlo->custom_call_target(); | ||
| } else { | ||
| hlo_name_str = HloOpcodeString(hlo->opcode()); |
There was a problem hiding this comment.
I'm not sure about this part since it would mean we can't tell the difference between each of the same HLO instructions anymore, e.g., dot.123 vs dot.42, etc. Maybe it would be better to improve the trace summarizer instead?
xla/service/cpu/ir_emitter.cc
Outdated
| auto hlo_name_str = hlo->name(); | ||
| if (hlo->opcode() == HloOpcode::kCustomCall) { | ||
| // For custom call, passing custom call target is more informative | ||
| hlo_name_str = hlo->custom_call_target(); |
There was a problem hiding this comment.
For custom call, it's probably still good to know the custom call id. Having custom-call.<id> as prefix should still be helpful, e.g., custom-call.46.__onednn$matmul.
|
@penpornk Thank you for review, I modified the code a bit , to encode more information to TraceMe API, hope this addresses your comments, let me know your thoughts on this. I am trying to avoid the long list generated at ops summary table in trace view, which sometimes is very slow to scroll if we have many hlo ops. It may be better if we just show the hlo opcodes in table and show which type of op is spending more time in execution, this is similar to what I have seen when using Tensorflow - Tensorboard trace view. As to distinguish the hlo op name, I encoded the hlo name and some metadata information as well, that way user will be able to point the exact hlo op name for that op type. Here is an example screenshot : 1) When clicked on reduce-window op in trace (TF-xla example) :
2) When clicked on onednn matmul (TF-XLA example) :
3) Additional example of onednn softmax with JAX-XLA :
|


Imported from GitHub PR openxla/xla#10164 This PR improves tracing a bit. Without this PR, you would see operations in trace view as : 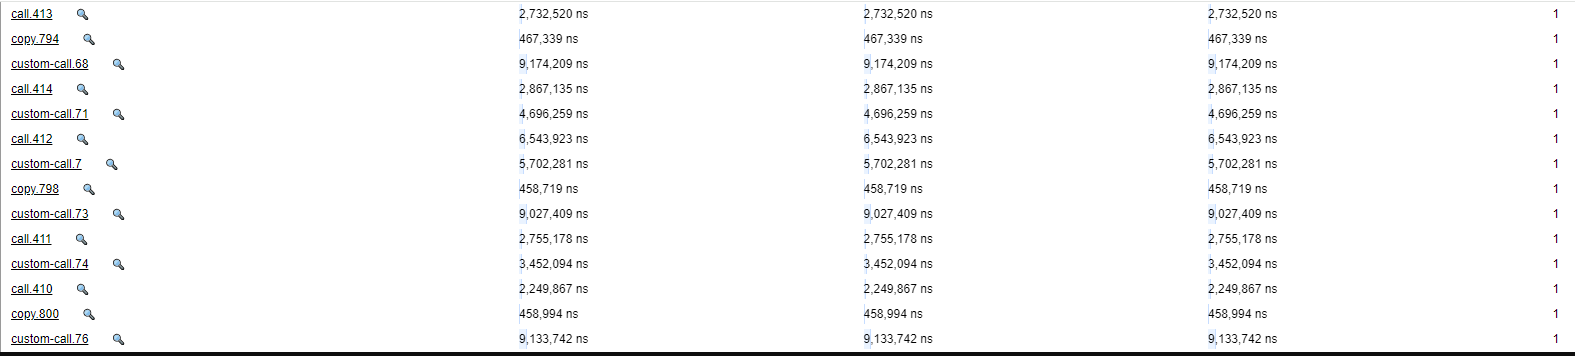 This way , it s difficult to see a) target of custom call b) can't group operations based on type of hlo operation and hence makes op list huge This PR addresses these problems and now you should see tensorboard trace view as : 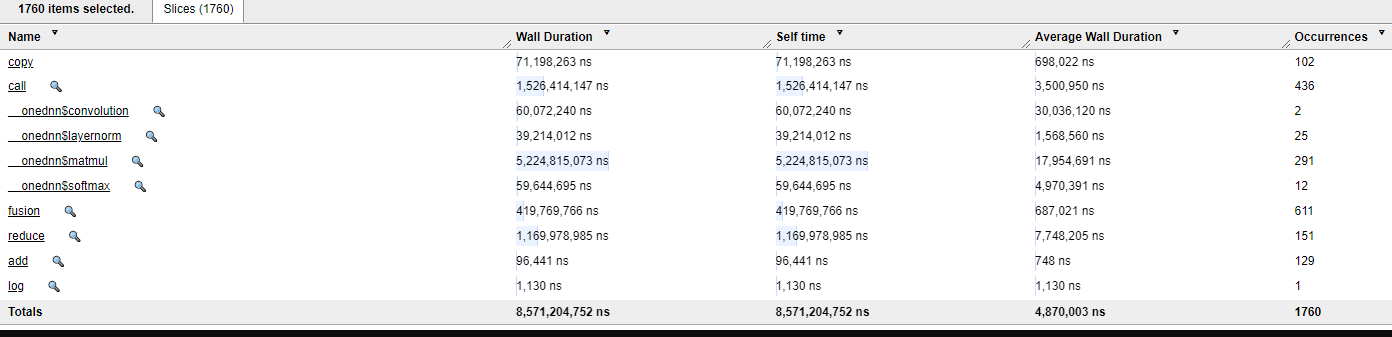 Copybara import of the project: -- 8cd6363890107ce7af2ed3630d577ad4d20a745b by Sachin Muradi <sachin.muradi@intel.com>: Update Trace emitter -- a2813ad7439da8934b98b12623193c3b120eb9ca by Sachin Muradi <sachin.muradi@intel.com>: more update Merging this change closes #10164 FUTURE_COPYBARA_INTEGRATE_REVIEW=openxla/xla#10164 from Intel-tensorflow:sachin/tracemeupdate a2813ad7439da8934b98b12623193c3b120eb9ca PiperOrigin-RevId: 622874494
Imported from GitHub PR openxla/xla#10164 This PR improves tracing a bit. Without this PR, you would see operations in trace view as :  This way , it s difficult to see a) target of custom call b) can't group operations based on type of hlo operation and hence makes op list huge This PR addresses these problems and now you should see tensorboard trace view as :  Copybara import of the project: -- 8cd6363890107ce7af2ed3630d577ad4d20a745b by Sachin Muradi <sachin.muradi@intel.com>: Update Trace emitter -- a2813ad7439da8934b98b12623193c3b120eb9ca by Sachin Muradi <sachin.muradi@intel.com>: more update Merging this change closes #10164 FUTURE_COPYBARA_INTEGRATE_REVIEW=openxla/xla#10164 from Intel-tensorflow:sachin/tracemeupdate a2813ad7439da8934b98b12623193c3b120eb9ca PiperOrigin-RevId: 622874494
FUTURE_COPYBARA_INTEGRATE_REVIEW=openxla/xla#10164 from Intel-tensorflow:sachin/tracemeupdate a2813ad7439da8934b98b12623193c3b120eb9ca
PiperOrigin-RevId: 622356332
FUTURE_COPYBARA_INTEGRATE_REVIEW=openxla/xla#10164 from Intel-tensorflow:sachin/tracemeupdate a2813ad7439da8934b98b12623193c3b120eb9ca
PiperOrigin-RevId: 623012044
FUTURE_COPYBARA_INTEGRATE_REVIEW=openxla/xla#10164 from Intel-tensorflow:sachin/tracemeupdate a2813ad7439da8934b98b12623193c3b120eb9ca
PiperOrigin-RevId: 622332776
FUTURE_COPYBARA_INTEGRATE_REVIEW=openxla/xla#10164 from Intel-tensorflow:sachin/tracemeupdate a2813ad7439da8934b98b12623193c3b120eb9ca
PiperOrigin-RevId: 622357346
FUTURE_COPYBARA_INTEGRATE_REVIEW=openxla/xla#10164 from Intel-tensorflow:sachin/tracemeupdate a2813ad7439da8934b98b12623193c3b120eb9ca
PiperOrigin-RevId: 622513596
Imported from GitHub PR openxla/xla#10164 This PR improves tracing a bit. Without this PR, you would see operations in trace view as :  This way , it s difficult to see a) target of custom call b) can't group operations based on type of hlo operation and hence makes op list huge This PR addresses these problems and now you should see tensorboard trace view as :  Copybara import of the project: -- 8cd6363890107ce7af2ed3630d577ad4d20a745b by Sachin Muradi <sachin.muradi@intel.com>: Update Trace emitter -- a2813ad7439da8934b98b12623193c3b120eb9ca by Sachin Muradi <sachin.muradi@intel.com>: more update Merging this change closes #10164 PiperOrigin-RevId: 623095394
This PR improves tracing a bit.
Without this PR, you would see operations in trace view as :

This way , it s difficult to see a) target of custom call b) can't group operations based on type of hlo operation and hence makes op list huge
This PR addresses these problems and now you should see tensorboard trace view as :
