Datadog is a monitoring service for IT, Operations and Development teams who write and run applications at scale, and want to turn the massive amounts of data produced by their apps, tools and services into actionable insight.
Supported releases and dependencies are shown below.
| kamon-datadog | status | jdk | scala |
|---|---|---|---|
| 1.0.0 | stable | 1.8+ | 2.10, 2.11, 2.12 |
To get started with SBT, simply add the following to your build.sbt file:
libraryDependencies += "io.kamon" %% "kamon-datadog" % "1.0.0"And add the Agent or API reporter to Kamon:
Kamon.addReporter(new DatadogAgentReporter())
// OR
Kamon.addReporter(new DatadogAPIReporter())
In order to get APM tracing working, add
Kamon.addReporter(new DatadogSpanReporter())
By default, the Agent reporter assumes that you have an instance of the Datadog Agent running in localhost and listening on
port 8125. If that is not the case, you can use the kamon.datadog.agent.hostname and kamon.datadog.agent.port configuration
keys to point the module at your Datadog Agent installation.
When using the API reporter you must configure your API key using the kamon.datadog.http.api-key configuration setting.
Since Kamon has access to the entire distribution of values for a given period, the API reporter can directly post the
data that would otherwise be summarized and sent by the Datadog Agent. Gauges andAll histogram-backed metrics will be reported as
follows:
- metric.avg
- metric.count
- metric.median
- metric.95percentile
- metric.max
- metric.min
You can refer to the Datadog documentation for more details.
As recommended , the Span reporter assumes that you have an instance of the Datadog Agent running in localhost and listening on
port 8125. If that is not the case, you can use the kamon.datadog.trace.http.api-url configuration
key to point the module at your Datadog Agent installation.
Don't forget to configure actors filtering for message tracing
Kamon keeps all timing measurements in nanoseconds and memory measurements in bytes. In order to scale those to other
units before sending to datadog set the time-units and memory-units config keys to desired units. Supported units are:
n  - nanoseconds
µs - microseconds
ms - milliseconds
s  - seconds

b  - bytes
kb - kilobytes
mb - megabytes
gb - gigabytes
For example,
kamon.datadog.time-units = "ms"
will scale all timing measurements to milliseconds right before sending to datadog.
- Contrary to other Datadog client implementations, we don't flush the metrics data as soon as the measurements are
taken but instead, all metrics data is buffered by the
kamon-datadogmodule and flushed periodically using the configuredkamon.metric.tick-intervalandkamon.datadog.max-packet-sizesettings. - It is advisable to experiment with the
kamon.metric.tick-intervalandkamon.datadog.agent.max-packet-sizesettings to find the right balance between network bandwidth utilisation and granularity on your metrics data.
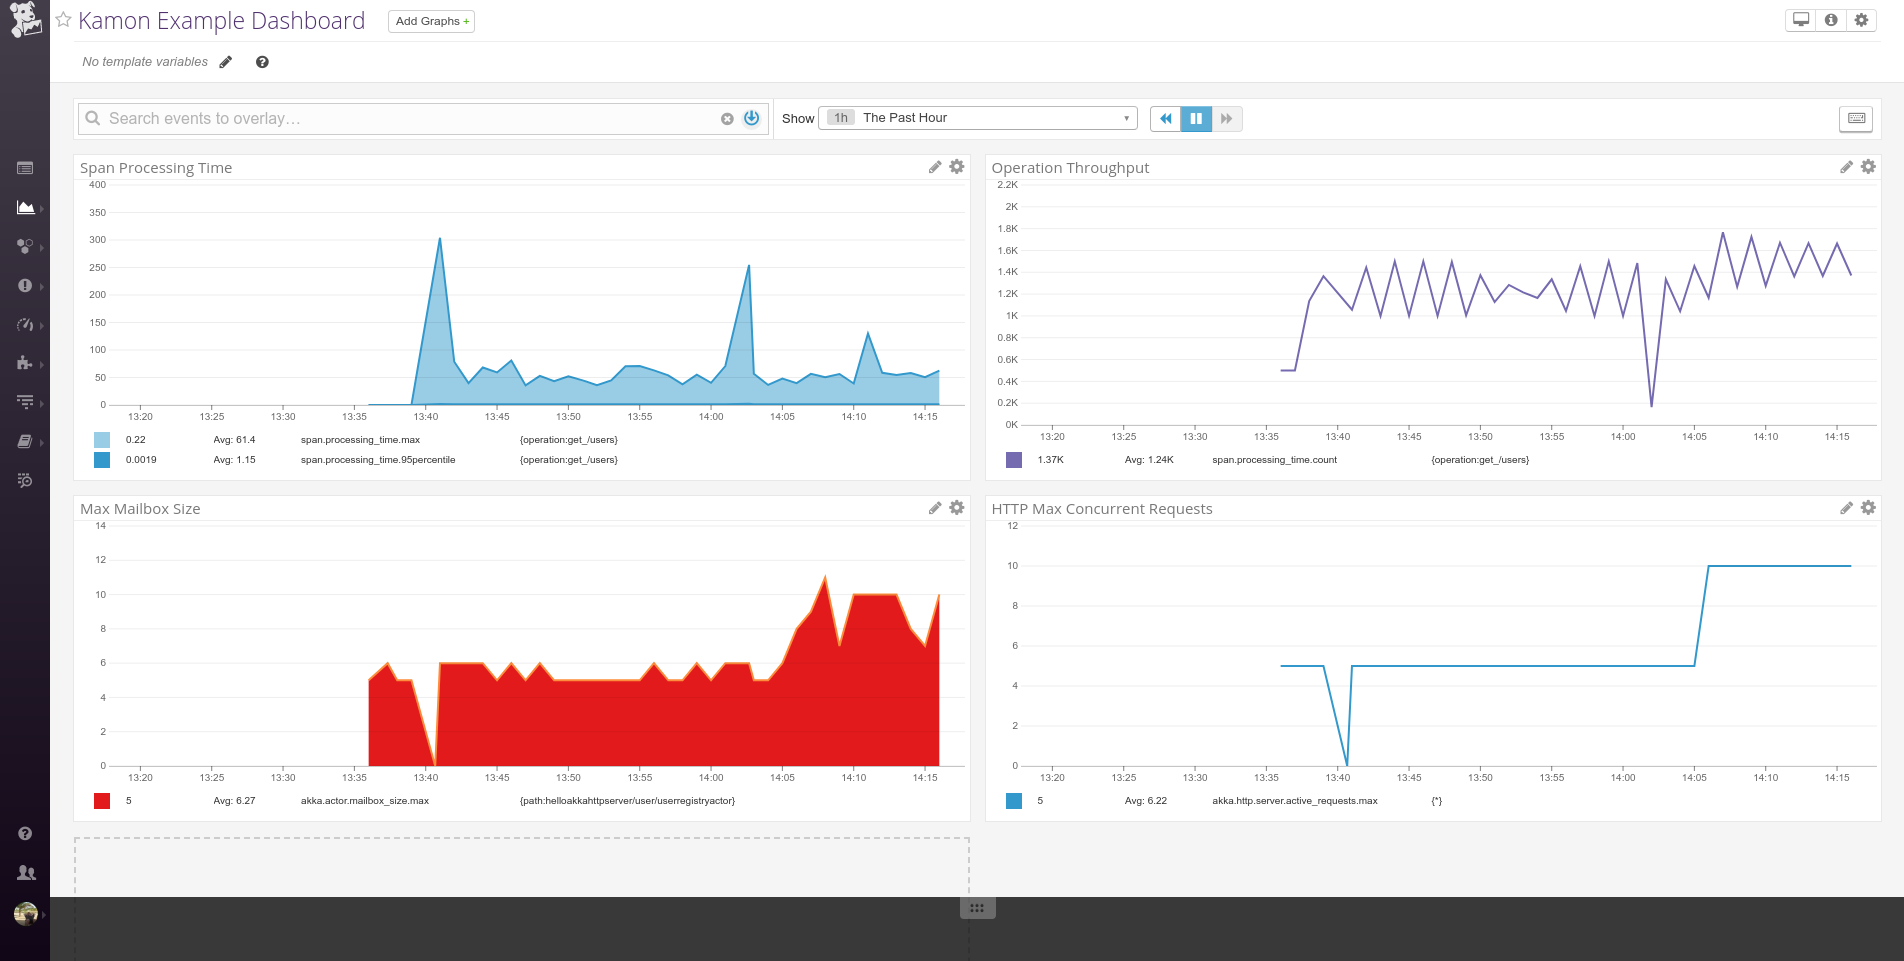
Creating a dashboard in the Datadog user interface is really simple, all metric names will match the Kamon metric names with the additional "qualifier" suffix. Here is a very simple example of a dashboard created with metrics reported by Kamon: