-
Notifications
You must be signed in to change notification settings - Fork 0
/
410-sci-pub-tool.qmd
440 lines (248 loc) · 10.3 KB
/
410-sci-pub-tool.qmd
1
2
3
4
5
6
7
8
9
10
11
12
13
14
15
16
17
18
19
20
21
22
23
24
25
26
27
28
29
30
31
32
33
34
35
36
37
38
39
40
41
42
43
44
45
46
47
48
49
50
51
52
53
54
55
56
57
58
59
60
61
62
63
64
65
66
67
68
69
70
71
72
73
74
75
76
77
78
79
80
81
82
83
84
85
86
87
88
89
90
91
92
93
94
95
96
97
98
99
100
101
102
103
104
105
106
107
108
109
110
111
112
113
114
115
116
117
118
119
120
121
122
123
124
125
126
127
128
129
130
131
132
133
134
135
136
137
138
139
140
141
142
143
144
145
146
147
148
149
150
151
152
153
154
155
156
157
158
159
160
161
162
163
164
165
166
167
168
169
170
171
172
173
174
175
176
177
178
179
180
181
182
183
184
185
186
187
188
189
190
191
192
193
194
195
196
197
198
199
200
201
202
203
204
205
206
207
208
209
210
211
212
213
214
215
216
217
218
219
220
221
222
223
224
225
226
227
228
229
230
231
232
233
234
235
236
237
238
239
240
241
242
243
244
245
246
247
248
249
250
251
252
253
254
255
256
257
258
259
260
261
262
263
264
265
266
267
268
269
270
271
272
273
274
275
276
277
278
279
280
281
282
283
284
285
286
287
288
289
290
291
292
293
294
295
296
297
298
299
300
301
302
303
304
305
306
307
308
309
310
311
312
313
314
315
316
317
318
319
320
321
322
323
324
325
326
327
328
329
330
331
332
333
334
335
336
337
338
339
340
341
342
343
344
345
346
347
348
349
350
351
352
353
354
355
356
357
358
359
360
361
362
363
364
365
366
367
368
369
370
371
372
373
374
375
376
377
378
379
380
381
382
383
384
385
386
387
388
389
390
391
392
393
394
395
396
397
398
399
400
401
402
403
404
405
406
407
408
409
410
411
412
413
414
415
416
417
418
419
420
421
422
423
424
425
426
427
428
429
430
431
432
433
434
435
436
437
438
439
440
---
title: "Open Tools for Scientific Publishing"
subtitle: "Present your research in an elegant and reproducible way."
author: "Otho Mantegazza _ Dataviz for Scientists _ Part 4.1"
editor_options:
chunk_output_type: console
knitr:
opts_chunk:
dev: jpeg
---
## Let's Try it
::: {.column width="80%"}
This is one of the most hands on section of the workshop. The best way to learn how to use this publishing tool, is to use it.
:::
##
{.absolute top=0 right=550 height="700"}
::: {.caption .absolute left=540 bottom=0}
SCIENTIFIC PUBLICATION ON THE DISCOVERY OF COLOUR BLINDNESS
Author: John Dalton
Year: 1794
Source: [Hathi Trust](https://catalog.hathitrust.org/Record/011812155)
*The father of the atomic theory John Dalton, realized that people might perceive colour differently and devised an experiment to test it. Discovering colour blindness, and that he was colour blind himself,*
Early scientific publications where in the shape of carefully crafted, extensively discursive booklets. Obviously, printed on paper.
:::
## Scientific Publishing
::: {.column width="80%"}
The main form of publication for a scientist still is the article on peer reviewed journals.
Although, as a scientist, you will find yourself communicating your work in many channels, such as reports, blog posts, presentations, books.
Or videos, posts on social media that unfortunately we will not cover here.
None of them less important than the peer reviewed article for making sure that your work reaches the people that need it and have an impact.
:::
## Literate Programming
{.absolute top=120 left=0}
::: {.absolute top=500 left=0}
::: {.column width="80%"}
Literate programming is a paradigm that allows us to mix analytic code and markup natural language. The main R tools for it a [Rmarkdown](https://rmarkdown.rstudio.com/), and now [Quarto](https://quarto.org/).
We will use Quarto.
:::
:::
## Data Driven Documents
::: {.column width="80%"}
As a quantitative scientist, your publications will often be data driven.
To make a data driven report, your best choice is to prepare documents with in which text and analytic code are tightly knit together, in this way you don't have to update the results manually if the starting data or the analytic code change on the way.
This will make your analyses more reproducible.
:::
## Markdown
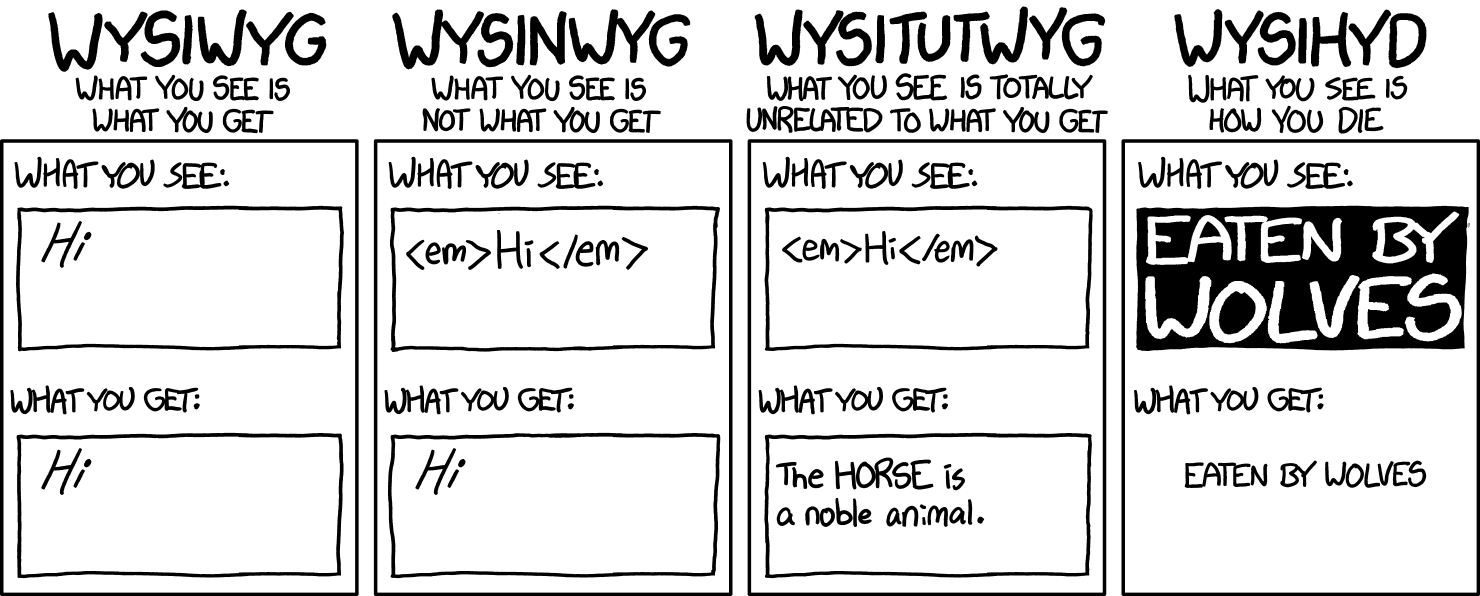
Markdown is an extremely simplified markup language. Also known is [WYSIWYM](https://xkcd.com/1341/): what you see is what you mean. When you write in Quarto you use markdown.
{.absolute top=250 left=0}
## Two Editor Paradigms
::: {.columns}
::: {.column width="47%"}
### WYSIWYG
What you see is what you get: while your write, on your screen, you see formatted text. If you want to break a paragraph you see a paragraph break, if you want italic text you see italic text and so on.
For sure you have used WYSIWYG editors, such as Microsoft Words, or [Google Docs](https://www.google.com/docs/about/).
:::
::: {.column width="47%"}
### WYSIWYM
What you see is what you mean: both body text and its formatting are expressed in text. You might have experience with it if you have used [HTML](https://developer.mozilla.org/en-US/docs/Glossary/HTML) or [LaTeX](https://www.latex-project.org/).
In HTML, if you want to write *hello* in italic, you write:
`<em>hello<\em>`
When you write in WYSIWYM,you use markup languages.
:::
:::
## Markdown
::: {.column width="80%"}
[Markdown](https://en.wikipedia.org/wiki/Markdown) is a markup language that's simple and easy to read.
```md
# This is a title
## This is level 2 title
### This is a level 3 title
This is a paragraph with **bold text** and *italic text*.
Another paragraph with [a link to Wikipedia](https://en.wikipedia.org/wiki/Markdown)
```
:::
## More Markdown
```md
1. This is
1. A numbered
1. List
And:
- This is
- A Bullet
- List
```
## More Markdown
```md
You can also insert images:

And add tables
| First Column | Second Column |
|--------------|---------------|
| Content 1A | Content 1B |
| Content 2A | Content 2B |
> Indented Quote
```
## Exercise
::: {.column width="80%"}
Use this [online markdown editor](https://markdownlivepreview.com/) to reproduce (by copying and pasting) the main content of [R for Data Science's Chapter on Quarto](https://r4ds.hadley.nz/quarto).
Try to reproduce all formatting, such a bold text, lists, code blocks. Add the functional links.
If needed, get help [this markdown guide](https://garrettgman.github.io/rmarkdown/authoring_pandoc_markdown.html) or any manual and forum that you find and like.
:::
## Quarto
::: {.column width="80%"}
With [Quarto]() you can combine markdown text with code in many programming languages and produce many types of output.
:::
## Quarto Languages
Programming Languages:
- R
- Python
- Julia
- Javascript
## Quarto Output
::: {.columns}
::: {.column width=31%}
### Websites:
- Reports
- Blogs
- Slides
:::
::: {.column width=31%}
### PDF / EPUB
- PDF:
- Journal Articles
- Reports
- Epub
:::
::: {.column width=31%}
### Others
- MS Words
- MS Power Point
- Open Office
:::
:::
<br><br>
[Many More](https://quarto.org/docs/output-formats/all-formats.html)...
## Quarto File
{.absolute top=110 left=0}
::: {.columns}
::: {.column width="48%"}
x
:::
::: {.column width="48%"}
```{r echo = FALSE}
cat(readr::read_file("data/quarto-example.md"))
```
:::
:::
## My Quarto Project Structure
{.absolute top=110 left=550 width="450px"}
::: {.column width="47%"}
This is the project structure that I use for Quarto, when I work on web based project (such as these slides).
You can download a starter folder with this structure from [this Github repo](https://github.com/othomantegazza/quarto-starter).
:::
## More Info
::: {.column width="80%"}
For more information on Quarto, please follow the tutorial on [Quarto's website](https://quarto.org/docs/get-started/hello/rstudio.html), they are very clear and well done.
:::
## Exercise
::: {.columns width="80%"}
Try Quarto:
1. Install [Quarto CLI](https://quarto.org/docs/get-started/) on your computer.
2. Download and unzip the [quarto-starter folder](https://github.com/othomantegazza/quarto-starter) from this Github repo.
3. On your computer, open the file **quarto-starter.Rproj** in Rstudio.
4. Run this line of code at the R console to install all the packages used in this project through [renv](https://rstudio.github.io/renv/articles/renv.html)
```r
renv::restore()
```
*Continue the on next page → *
:::
## Exercise
::: {.columns width="80%"}
*→ from the previous page.*
5. Serve the Quarto project locally, by typing at the terminal console:
```sh
quarto preview
```
6. On [your browser](https://www.mozilla.org/en-US/firefox/new/) open the local host [http://localhost:4200](http://localhost:4200) to preview your quarto project.
7. Open the file **index.qmd** in rstudio, edit it, save your results. See how the preview in the browser changes accordingly.
:::
## Files in Quarto Projects
::: {.columns width="80%"}
The main files in a web based Quarto projects are:
- _quarto.yaml
- index.qmd
- Any other .qmd files
:::
## _quarto.yml
**\_quarto.yml** is a configuration file in [YAML format](https://yaml.org/):
```{r echo = FALSE}
cat(readr::read_file("data/quarto-yml-example.yml"))
```
## index.qmd
::: {.column width=80%}
**index.qmd** is the quarto file that produce the page that stands at the root (home page) of your website.
```{r echo = FALSE}
cat(readr::read_file("index.qmd"))
```
:::
## Style
::: {.column width=80%}
If the output of your project is web based, you can style it with [CSS](https://developer.mozilla.org/en-US/docs/Web/CSS), or [SCSS](https://quarto.org/docs/output-formats/html-themes-more.html).
CSS or SCSS are a complex but powerful tool to style the web, you can style each HTML element by name.
For example, style the main title with:
```css
h1 {
font-family: Noto Serif, Serif;
font-weight: 400;
font-size: 50px;
}
```
You can find an example in the folder **style/custom.scss**.
:::
## Inspect HTML elements
::: {.column width=47%}
In [Firefox](https://www.mozilla.org/en-US/firefox/new/), you can open the page inspector with
- **Ctrl + Shift + C** on Windows or Linux.
- **Cmd + Shift + C** on Mac OS.
You can use it to identify the name of the page elements that you want to style.
:::
##
{.absolute}
## Exercise
::: {.column width=80%}
Explore data in your own web based Quarto project.
You can choose to start from:
- Downloading this [example Quarto project](https://github.com/othomantegazza/quarto-example), which you can find [deployed here](https://quarto-demo.otho.app/). Give a look at this option also as an example of what you can do.
- From the empty [Quarto Starter](https://github.com/othomantegazza/quarto-starter), which we used in the previous exercise.
- By [starting your own Quarto project](https://quarto.org/docs/get-started/hello/rstudio.html), in Rstudio, from scratch.
More info on next page...
:::
## Exercise
::: {.column width=80%}
...chose some data that you would like to analyze and report on them, combining data visualization, and text.
On data, you have many options:
- Schengen [statistics on short stay visa](https://home-affairs.ec.europa.eu/policies/schengen-borders-and-visa/visa-policy_en), which are already included in the [example Quarto project](https://github.com/othomantegazza/quarto-example).
- This dataset on [microchip development](https://chip-dataset.vercel.app/).
- Any dataset from previous exercises, that you liked and that you would like to keep working on.
Feel free to experiment with Quarto, to modify styles, headers and settings, don't be afraid to break things.
:::
## Exercise
::: {.column width=80%}
(EXTRA)
Publish your results online in a website.
1. Make a free [Netlify account](https://app.netlify.com).
2. Start a new website from manual deploy.
3. Drag and drop the **docs/** folder of your quarto project into Netlify and see it go live online.
Watch out! everything that's in the **docs/** folder will become public, check that you did not include any sensitive personal information in your analysis.
:::