-
Notifications
You must be signed in to change notification settings - Fork 9
otonchev/grove_dust
This commit does not belong to any branch on this repository, and may belong to a fork outside of the repository.
Folders and files
| Name | Name | Last commit message | Last commit date | |
|---|---|---|---|---|
Repository files navigation
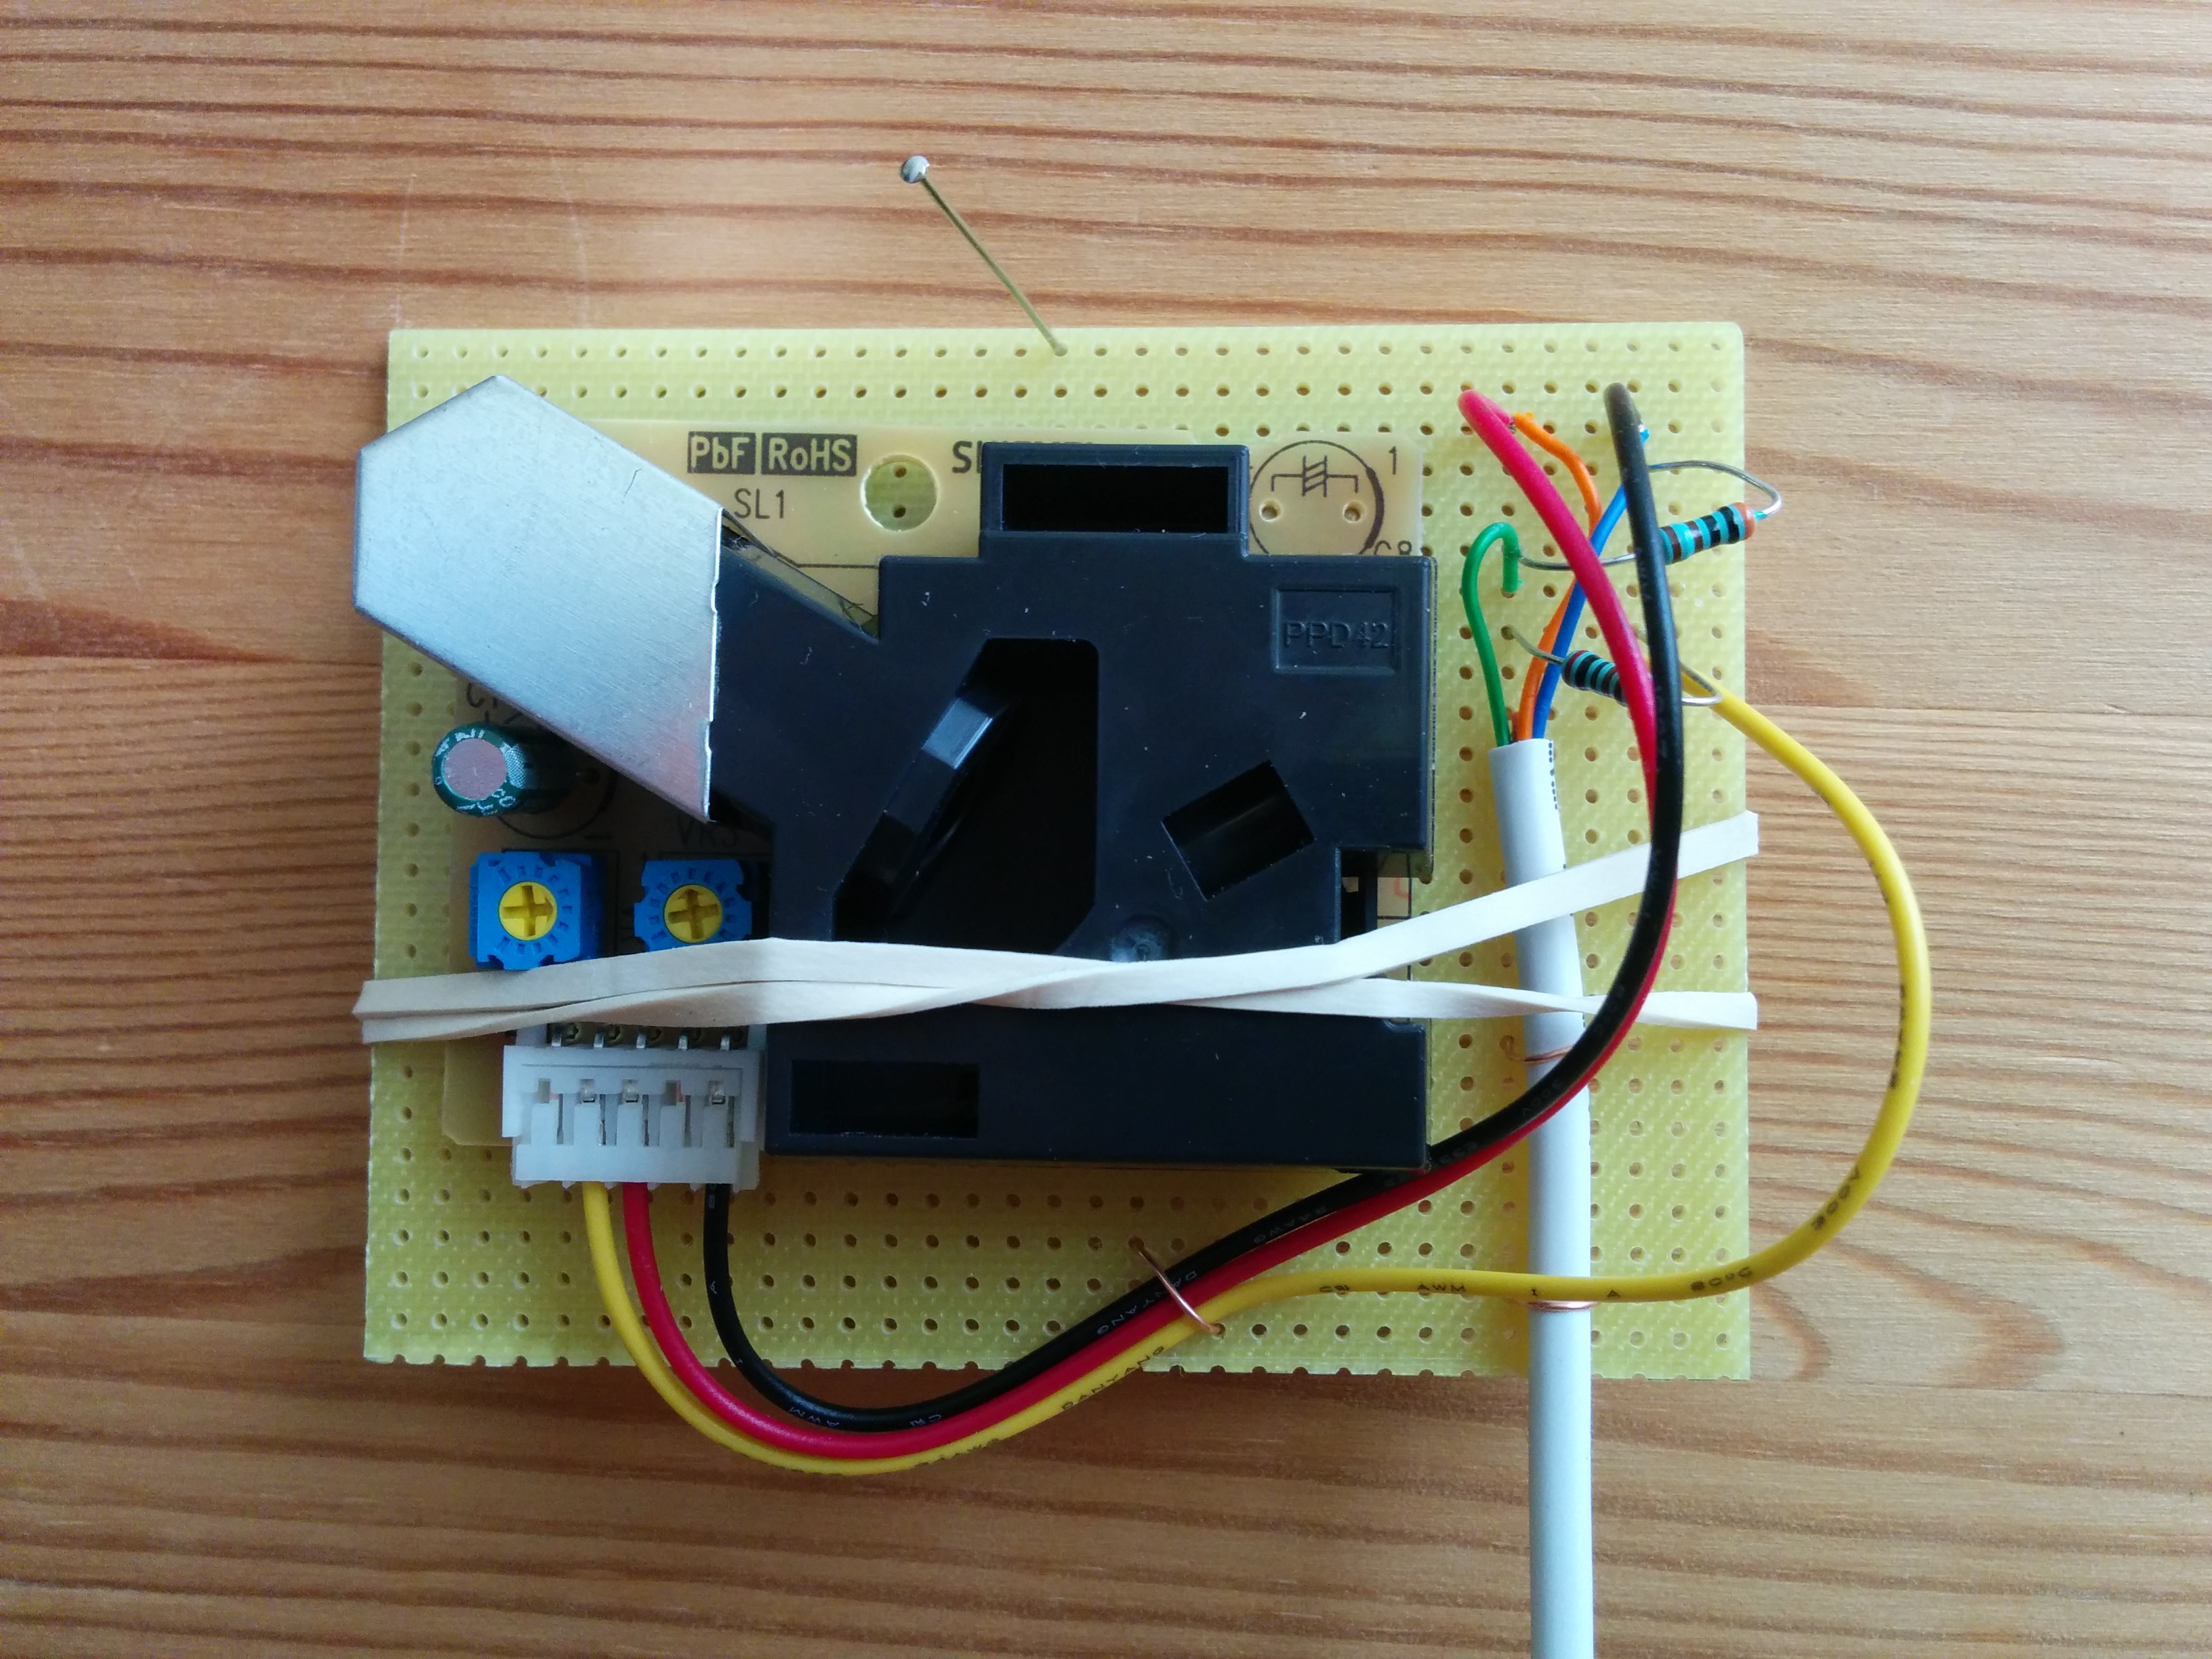
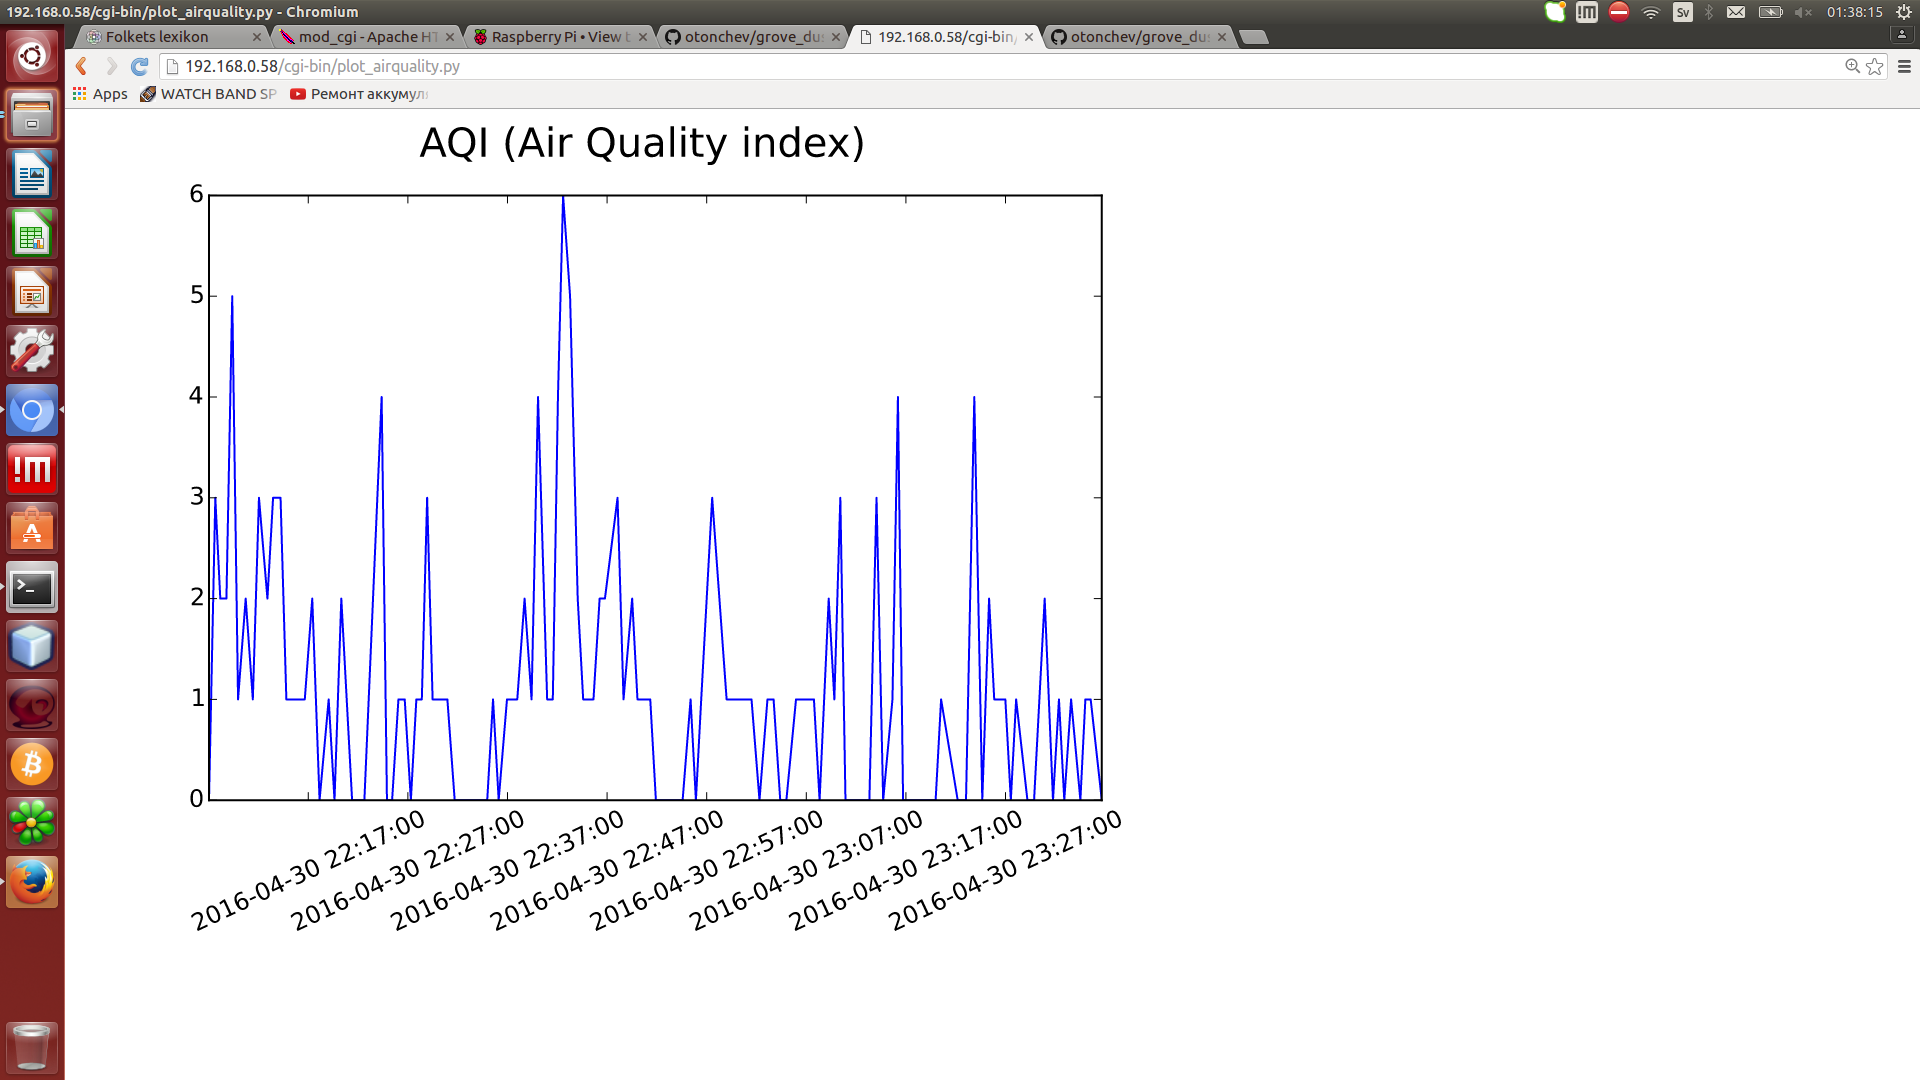
Grove Dust sensor(Shinyei PPD42NS) and Raspberry Pi
---------------------------------------------------

This project demonstrates how to monitor/visualize the air quality in an
environment by measuring the dust concentration with the Grove Dust sensor(Shinyei
PPD42NS) connected to Raspberry Pi.
Results are pretty similar to a setup where the Grove Dust sensor is connected
to the digital input port N8 on Arduino Uno.

SHINYEI ppd42:
https://raw.githubusercontent.com/otonchev/grove_dust/master/images/shinyei.jpg

Dust concentration is measured in pcs/0.01cf and μg/m3. AQI (Air quality index)
is also calculated for direct comparison with data on http://aqicn.org.

Example installation:

Fine particle (PM2.5) in Lund, Sweden, Live data
http://ogy.ddns.net:5678/home (Inside Air Quality)
http://ogy.ddns.net:5678/home/floor1/DustConcentration?history
This is part of the Homefrog Home Automation Framework:
https://github.com/otonchev/homefrog

Fine particle (PM2.5) in Sofia, Bulgaria, Krasno selo, ul. Pchela
Фини прахови частици (ПМ2.5) София, Красно село, улица Пчела
http://87.121.162.187:3456/cgi-bin/airquality.py
http://87.121.162.187:3456/cgi-bin/plot_airquality.py

To run the project:

    git clone

    make test
    ./test

OR

    make test_async
    ./test_async

OR

    make test_mysql
    ./test_mysql

No third-party software is required to run the applications.

All test applications use lngpio which is part of the project, it provides two
APIs for reading the GPIO:

1. synchronous API with a pulseIn alike function, ./test uses that one
2. asyncronous API with callbacks, ./test_async demontrates how to use it

Example output (./test && ./test_async):

161.748291 pcs/0.01cf, 0.252226 μg/m3, 1 AQI
510.323608 pcs/0.01cf, 0.795786 μg/m3, 3 AQI
696.272583 pcs/0.01cf, 1.085750 μg/m3, 4 AQI
523.159485 pcs/0.01cf, 0.815802 μg/m3, 3 AQI
324.386963 pcs/0.01cf, 0.505841 μg/m3, 2 AQI
424.624207 pcs/0.01cf, 0.662149 μg/m3, 2 AQI
131.289444 pcs/0.01cf, 0.204730 μg/m3, 0 AQI
715.067444 pcs/0.01cf, 1.115059 μg/m3, 4 AQI

./test_mysql stores data into a MySQL database so that it can be later retrieved
and plotted for example. For the test app to work set up the database in the
following way:

    mysql -h localhost -u root -ppass
    mysql> CREATE DATABASE AirQuality;
    mysql> use AirQuality;
    mysql> CREATE TABLE ParticlePM25 (concentration_pcs FLOAT, \
        concentration_ugm3 FLOAT, aqi INT, ts_created TIMESTAMP);
    mysql> quit
    Bye

Required packages:

    sudo apt-get install mysql-server
    sudo apt-get install libmysqlclient-dev

For plotting/displaying the result in a browser, look at plot/README

Example Air Quality graph:
https://raw.githubusercontent.com/otonchev/grove_dust/master/images/plot.png

The Shinyei sensor is connected to the GPIO on the Raspberry Pi in the following
manner:

          +------------------+
          |                  |
          |  Shinyei PPD42   |
          |                  |
          +------------------+
            |      |       |
            | black|       |yellow          _____
         red|      |       +---------------[_____]-----+
            |      |                         2kOm      |
            |      |               _____               |
            |      +--------+-----[_____]--------------+
            |               |       3kOm               |
            *               *                          *
       GPIOPin2(5V)    GPIOPin6(GND)             GPIOPin11(17)

1) Red wire to Pin 2(5V)
2) Black wire to Pin 6(GND)
3) Black wire to a 3k resistor which on the other end is connected to Pin 11
(GPIO17)
4) Pin 11(GPIO17) to a 2k resistor which on the other end connects to Yellow
wire
About
Monitor/Log/Share Fine particle (PM2.5) with Grove Dust sensor(Shinyei PPD42NS) and Raspberry Pi
Resources
Stars
Watchers
Forks
Releases
No releases published