Acquire and process live and historical air quality data without efforts.


Status

Usage
Compatibility


Acquire and process live and historical air quality data without efforts.
Filter by station-id, sensor-id and sensor-type, apply reverse geocoding, store into time-series and RDBMS databases (InfluxDB and PostGIS), publish to MQTT, output as JSON, or visualize in Grafana.
Data sources: Sensor.Community (luftdaten.info), IRCELINE, and OpenAQ.
- Luftdatenpumpe acquires the measurement readings either from the livedata API of luftdaten.info or from its archived CSV files published to archive.luftdaten.info. To minimize impact on the upstream servers, all data gets reasonably cached.
- While iterating the readings, it optionally filters on station-id, sensor-id or sensor-type and restrains information processing to the corresponding stations and sensors.
- Then, each station's location information gets enhanced by
- attaching its geospatial position as a Geohash.
- attaching a synthetic real-world address resolved using the reverse geocoding service Nominatim by OpenStreetMap.
- Information about stations can be
- displayed on STDOUT or STDERR in JSON format.
- filtered and transformed interactively through jq, the swiss army knife of JSON manipulation.
- stored into RDBMS databases like PostgreSQL using the fine dataset package. Being built on top of SQLAlchemy, this supports all major databases.
- queried using advanced geospatial features when running PostGIS, please follow up reading the Luftdatenpumpe PostGIS tutorial.
- Measurement readings can be
# List networks
luftdatenpumpe networks

# List LDI stations
luftdatenpumpe stations --network=ldi --station=49,1033 --reverse-geocode

# Store list of LDI stations and metadata into RDBMS database (PostgreSQL), also display on STDERR
luftdatenpumpe stations --network=ldi --station=49,1033 --reverse-geocode --target=postgresql://luftdatenpumpe@localhost/weatherbase

# Store LDI readings into InfluxDB
luftdatenpumpe readings --network=ldi --station=49,1033 --target=influxdb://luftdatenpumpe@localhost/luftdaten_info

# Forward LDI readings to MQTT
luftdatenpumpe readings --network=ldi --station=49,1033 --target=mqtt://mqtt.example.org/luftdaten.info
For a full overview about all program options including meaningful examples, you might just want to run luftdatenpumpe --help on your command line, or visit the Luftdatenpumpe usage documentation section.
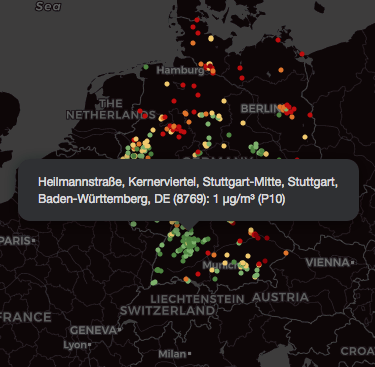
Luftdaten-Viewer displays stations and measurements from luftdaten.info (LDI) in Grafana.
- Filter by different synthesized address components and sensor type.
- Display measurements from filtered stations on Panodata Map Panel.
- Display filtered list of stations with corresponding information in tabular form.
- Measurement values are held against configured thresholds so points are colored appropriately.
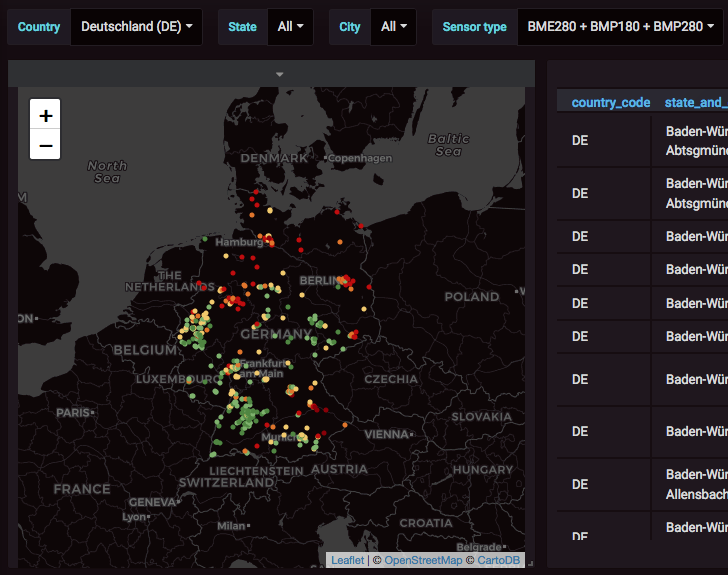
- Humanized label computed from synthesized OpenStreetMap address.
- Numeric station identifier.
- Measurement value, unit and field name.
If you are running Python 3 already, you can installing the program using pip. We recommend to use a Python virtualenv.
pip install luftdatenpumpe --upgradeAt this point, you should be able to conduct simple tests like luftdatenpumpe stations as seen in the synopsis section above. At least, you should verify the installation succeeded by running:
luftdatenpumpe --versionAt install Luftdatenpumpe, you will find more detailed installation instructions about how to install and configure auxiliary services, and eventually resolve some prerequisites.
Using Luftdatenpumpe, you can build user-friendly interactive GIS systems on top of PostGIS, InfluxDB and Grafana. This setup is called "Luftdaten-Viewer", and some example scenarios can be inspected at Luftdatenpumpe gallery.
These installation instructions outline how to setup the whole system to build similar interactive data visualization compositions of map-, graph- and other panel-widgets like outlined in the "Testimonials" section.
Visualize recent sensor data on a world map for Sensor.Community and for different other official networks, like EEA, Luchtmeetnet, Atmo AURA/Sud/Occitanie, and Umweltbundesamt.
- https://github.com/pjgueno/SCPublicData
- https://forum.sensor.community/t/scraping-pm-data-help-needed/1448
Any kind of contribution, feedback, or patch, is much welcome. Create an issue or submit a patch if you think we should include a new feature, or to report or fix a bug.
The project is licensed under the terms of the GNU AGPL license, see LICENSE.
The copyright of particular images and pictograms are held by their respective owners, unless otherwise noted.
- Water Pump Free Icon from Icon Fonts is licensed by CC BY 3.0.